Defensive End RAS: Does It Matter? A Comprehensive Analysis
In part 43 of our “Does It Matter?” series, we looked to answer the question of whether the Relative Athletic Score (RAS)


In the 40th installment of our “Does It Matter?” series, we looked into defensive ends to explore whether their height plays a role in predicting their NFL success. Using our data, we found an optimal range for Defensive End heights, found a Pearson value to find standard statistical correlation, and applied our optimal range to the 2024 NFL DE class. Here are all our findings:
Our research began by scrutinizing the top 50 fantasy football finishers annually since 2003. In this article, you will see the term “bottom 10”, which refers to players who finished between the 41st and 50th place each season. All of our height data was sourced from the NFL Draft Combine, consistency.
Why the top 50? Selecting the top 50 was a strategy we employed to have a “happy medium.” This balances the possibility of skewing the data with fringe roster players who perform lower than the top 50 and naturally won’t finish in the top 10. On the other hand, we wanted to truly compare the best to the worst, which is the reason for the gap between the top 10 and what we defined as the bottom 10 (41st and 50th place).
Everybody knows stats are cool, but which stats are the coolest and mean the most? Additionally, what are the target benchmarks athletes should aim to achieve in each statistic? That's what this chart answers. Type in your desired position in the "Position" field to see the key metrics players need for a higher chance of NFL success. Then, filter the success boost or Pearson value from highest to lowest to see which stats mean the most. Pearson values of 0.1 and higher OR -0.1 or lower indicates correlation. Unlock all metrics by signing up with the links provided. For only $0.99/month!
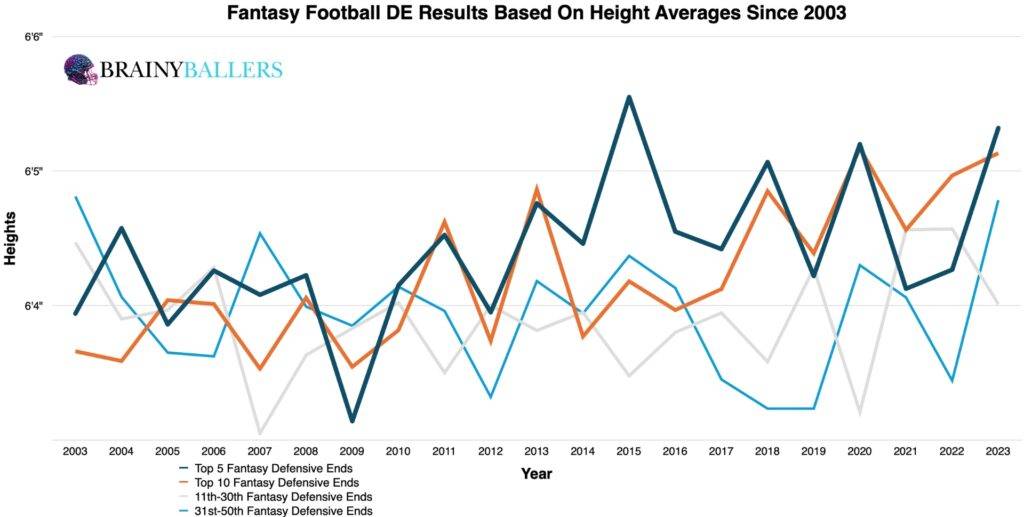
To visualize possible trends, we created an averages chart. This broke down leaderboards into top 5, top 10, 11th-30th, and 31st-50th place finishers’ averages since 2003. The findings were obvious: 18 of the last 21 seasons (85.7%), players finishing in the top 5 had the same, or greater, height averages compared to those in the “bottom 10.” This suggested a potential correlation between height and NFL success.
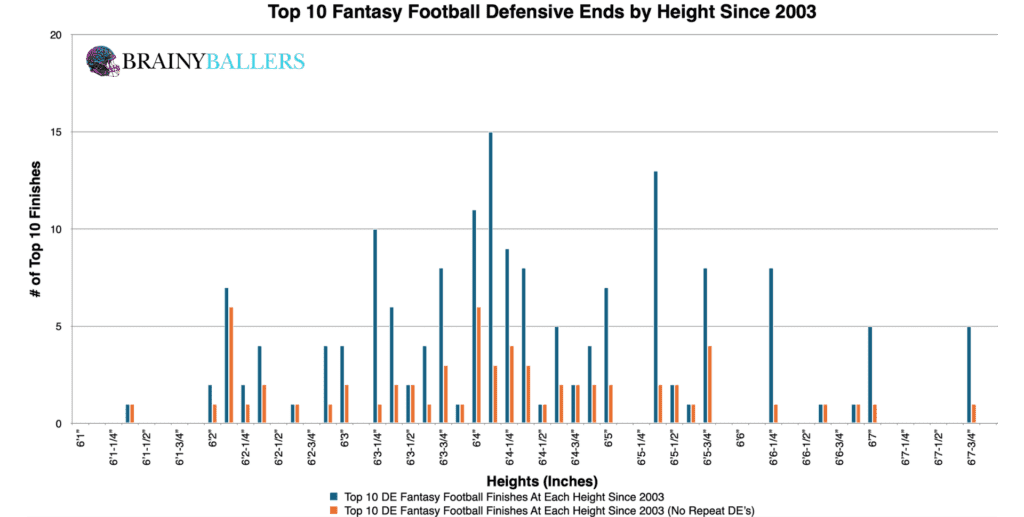
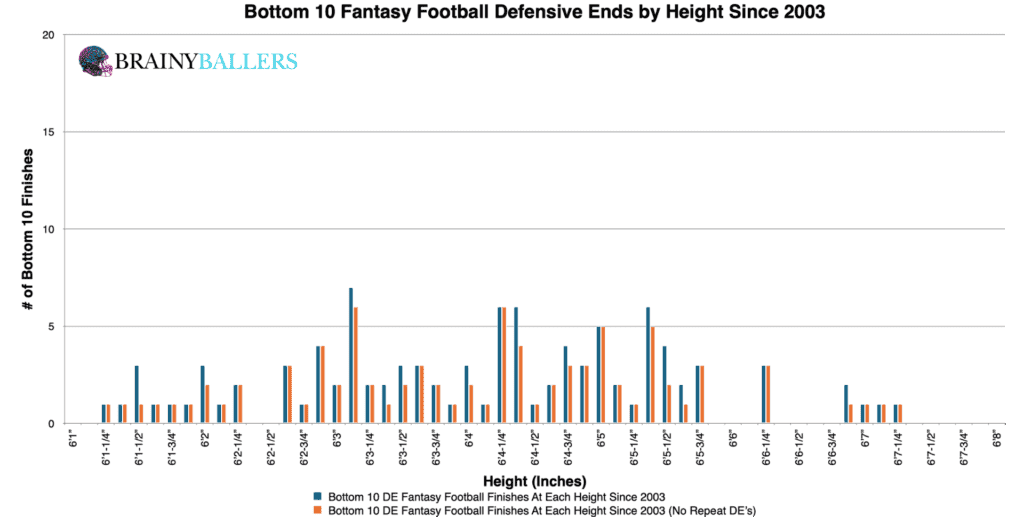
We segmented the top and bottom 10 finishers into 0.125-inch increments to see the full breakdown of where players were. This chart revealed that the top 10 was mainly weighted towards greater height when compared to the bottom 10. Those charts can be seen below:
Next, we created a differences chart that compared each top 10 height against the bottom 10, including the next 0.5 inches at each indicated increment. This method was an attempt to identify a height range where the highest increase in performances occurred. The chart’s desired outcome is a negative number for unique differences (Orange) and a positive number for non-unique differences (Blue). This analysis revealed that the height range between 6’3-1/4” and 6’4-5/8” was a possible optimal range. If you are curious why the differences chart is all positive, this was due to a data imbalance: 168 top 10 finishers have height data, compared to just 104 in the bottom 10, based on NFL Combine records. We next will attempt to verify this as the optimal range, or find a close one that prevails a higher producing one.
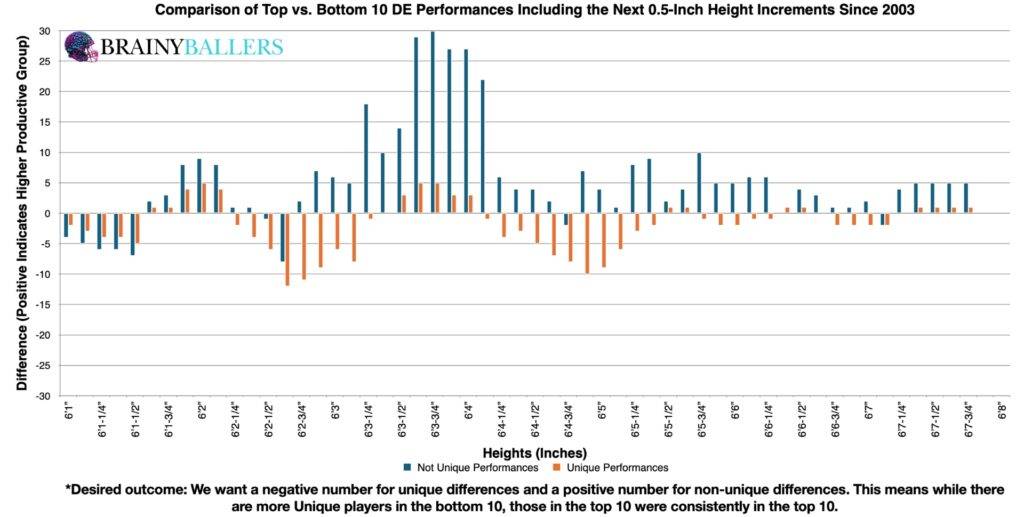
After several adjustments in our spreadsheet, this range emerged as the highest producer. We test both the top end of this range and the bottom. We found that this range produced a 16.8% greater top 10 presence than the bottom 10 finishers. Therefore, 6’3-1/4” to 6’4-5/8” is our optimal range for DE Heights and will be this study’s subject going forward.
We now looked to find a critical threshold to establish a bare minimum for what Defensive Ends should measure in at. Those findings can be seen below:
With a minimum height of 5’11-5/8” being consistent across the board, this became our critical threshold for Defensive Ends in our StarPredictor Score (SPS) model. Essentially, Defensive Ends must measure in at least at 5’11-5/8” in order to not be considered a future bust by our model. We are hoping to have this model fully functional by the beginning of the 2027 NFL season. You can subscribe to our mailing list to get updates on this model when it begins coming out here:
The Pearson correlation value, calculated at 0.087, indicated no significant correlation between a defensive end’s height and their fantasy production. For reference to something that everyone acknowledges matters in prospect scouting, and to show the accompanying Pearson value, RB draft capital prevailed a -0.234 Pearson value. We are hoping for a minimum of 0.1, or an inverse correlation maximum of -0.1 when we study world-class athletes as we are.
To reveal whether this is an emerging or dying trend, we extended our analysis to analyze this optimal range across the last 2 decades. The decadal differences chart showed this height range as an emerging trend among top performers, suggesting its increasing relevance in the NFL.
| 2004-2013 | |||
| Top 10 | 11 through 40 | Bottom 10 | |
| All count | 83 | 185 | 49 |
| All Between 6’3-1/4 and 6’4-5/8” | 43 | 73 | 19 |
| % (Optimal Range/all) | 51.8% | 39.5% | 38.8% |
| 2014-2023 | |||
| Top 10 | 11 through 40 | Bottom 10 | |
| All count | 77 | 164 | 51 |
| All Between 6’3-1/4 and 6’4-5/8” | 33 | 52 | 11 |
| % (Optimal Range/all) | 42.9% | 31.7% | 21.6% |
Now that we have our findings, we decided to backtest with the 2024 NFL DE class. We evaluated how these incoming players fit into the identified optimal height range. That breakdown can be seen below:
| Khalid Duke | 6032 |
| Bralen Trice | 6034 |
| Jaylen Harrell | 6036 |
| Jalyx Hunt | 6036 |
| Brennan Jackson | 6037 |
| Trajan Jeffcoat | 6037 |
| David Ugwoegbu | 6037 |
| Jared Verse | 6037 |
| Adisa Isaac | 6041 |
| Austin Booker | 6044 |
| Eyabi Okie-Anoma | 6044 |
| Javontae Jean-Baptiste | 6045 |
| Laiatu Latu | 6046 |
| Jonah Elliss | 6021 |
| Xavier Thomas | 6022 |
| Nelson Ceaser | 6026 |
| Zion Tupuola-Fetui | 6026 |
| Solomon Byrd | 6027 |
| Chop Robinson | 6027 |
| Cedric Johnson | 6030 |
| Marshawn Kneeland | 6030 |
| Braiden McGregor | 6052 |
| Eric Watts | 6055 |
| Myles Cole | 6060 |
Height alone clearly doesn’t guarantee success. Through our analysis, we identified 6’3-1/4” to 6’4-5/8” as the optimal height range that helps, but doesn’t enable success enough to say it matters. Traditional statistical methods proved that, meaning height shouldn’t be a main priority in scouting Defensive Ends.
Everybody knows stats are cool, but which stats are the coolest and mean the most? Additionally, what are the target benchmarks athletes should aim to achieve in each statistic? That's what this chart answers. Type in your desired position in the "Position" field to see the key metrics players need for a higher chance of NFL success. Then, filter the success boost or Pearson value from highest to lowest to see which stats mean the most. Pearson values of 0.1 and higher OR -0.1 or lower indicates correlation. Unlock all metrics by signing up with the links provided. For only $0.99/month!
Our series has always sought to push the boundaries of sports analytics. This latest installment reaffirms our commitment to uncovering the hidden dynamics that define the game. Every Saturday, we’ll dive into intriguing questions, bust myths, and settle debates with thorough analysis. We welcome your input. Therefore, please leave comments or reach out with topics you’re eager to see dissected. All of our research can be found on our Analytics Page. Up next on our agenda for Part 41 of “Does It Matter?” is an examination of Defensive End Weight: Does it matter? If so, what’s the weight threshold necessary for NFL success? Mark your calendars; every Saturday we shed light on the topics that matter to you. All it takes is a quick question being asked and we will go to work for you!
Support these analytics and unlock our Ultimate Athlete Blueprints, where all of our research comes together in one table for all positions. 7 day free trial. Cancel anytime.

BrainyBallers Buy-Hold-Sell Chart (All Players)
Make Money on BrainyBallers’ (Or anyone’s) content if it turns out to be incorrect!
Get Your Products 100% Refunded By Predicting The Next SuperBowl Winner!
In part 43 of our “Does It Matter?” series, we looked to answer the question of whether the Relative Athletic Score (RAS)

This week, we looked at the projections of 6 Fantasy Football analysts and ranked them from the most accurate to the least.
In part 42 of our “Does It Matter?” series, we collected and examined data to find the significance of a Defensive End’s
