
Can College Yards After Catch Help Predict NFL Success For Wide Receivers?
For our 61 part “Does It Matter?” series, we looked into whether a Wide Receiver’s College Yards After Catch per Reception (YAC/Rec)


For part 10 of our “Does It Matter?” series, we looked into the significance of 40 yard dash times in predicting the success of NFL running backs. After finding a RB Height sweet spot last week, this week the findings were even more significant by a wide margin. Further, regression testing revealed 40-yard dash times strongly correlate to increased RB production. Here are all our findings.
For our methodology, we focused on the top 50 PPR fantasy football finishers since 2003. We used NFL draft combine numbers exclusively to maintain consistency. Throughout this article you will see “bottom 10.” That is defined as fantasy football finishers 41-50.
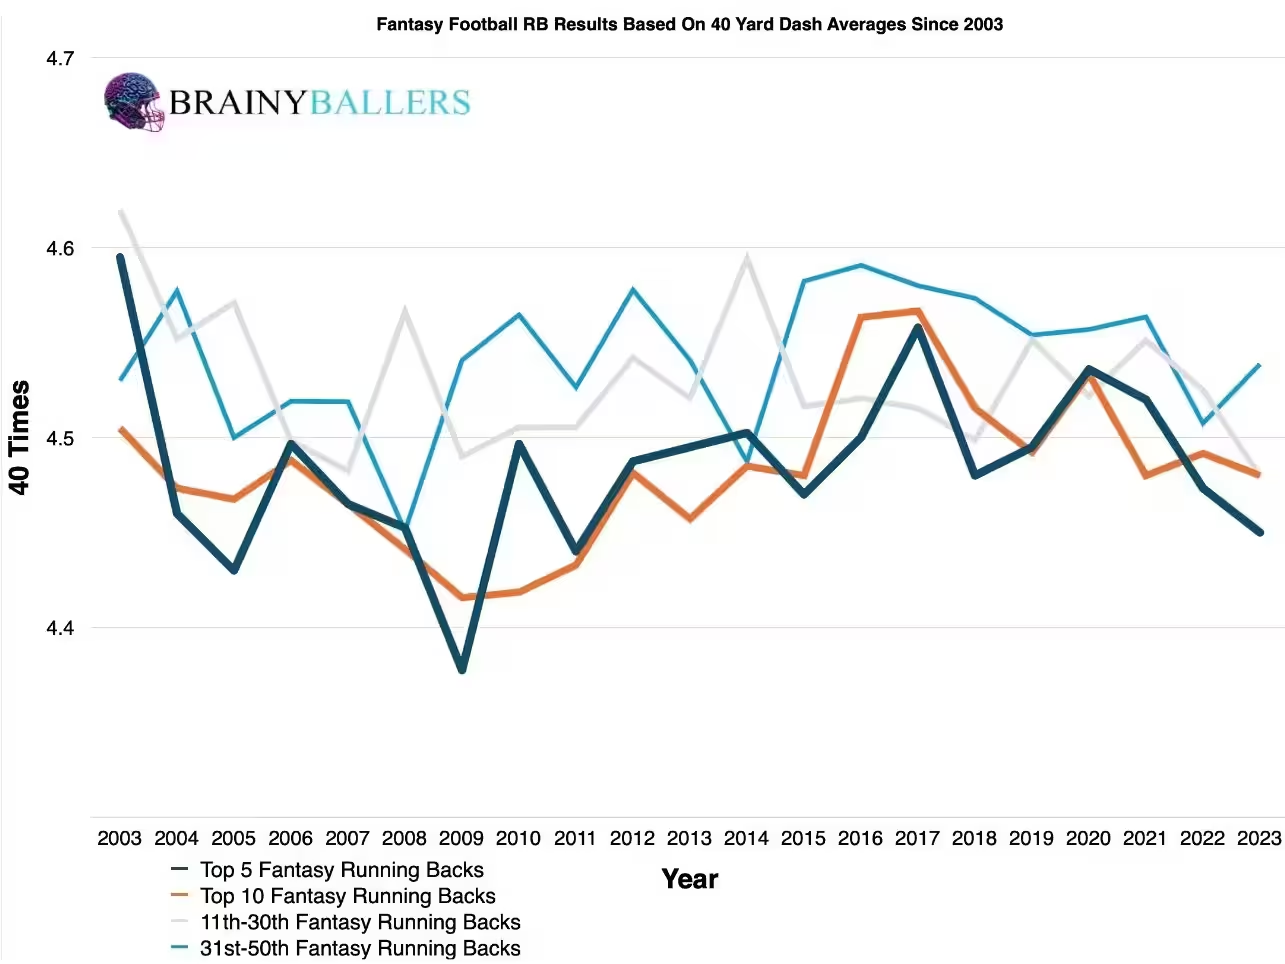
By comparing averages for performance metrics, we get a feel for trends in how 40-yard dash times impact RB success. We broke it down into multiple groups: Top 5, 10, 11-30th, and 31st-50th place RB finishers since 2003. Through this chart, we observed a consistent trend where top performers (dark blue line) showcased lower 40 yard dash times compared to 31st-50th (light-blue line) finishers 18/21 (85.7%) seasons.
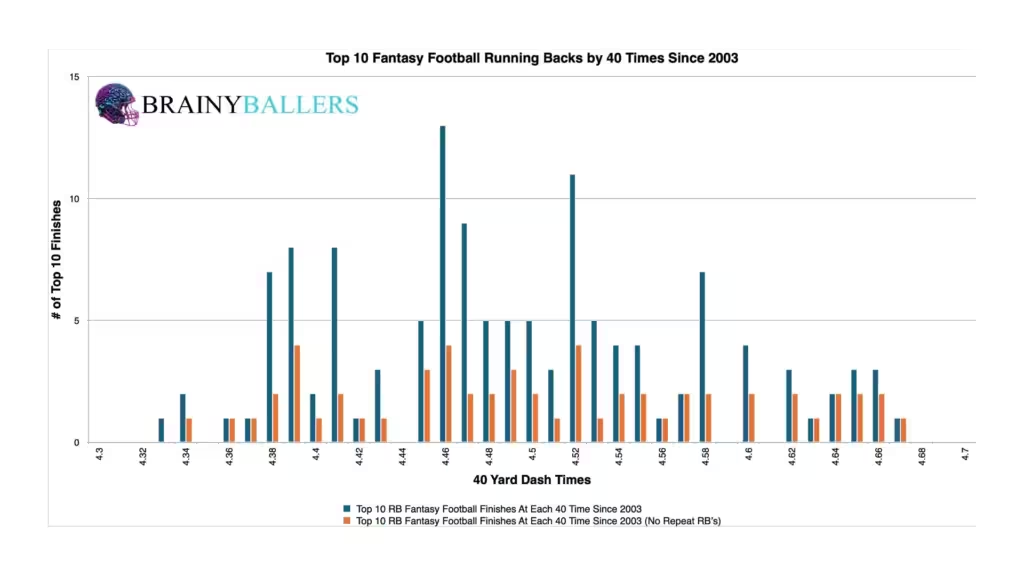
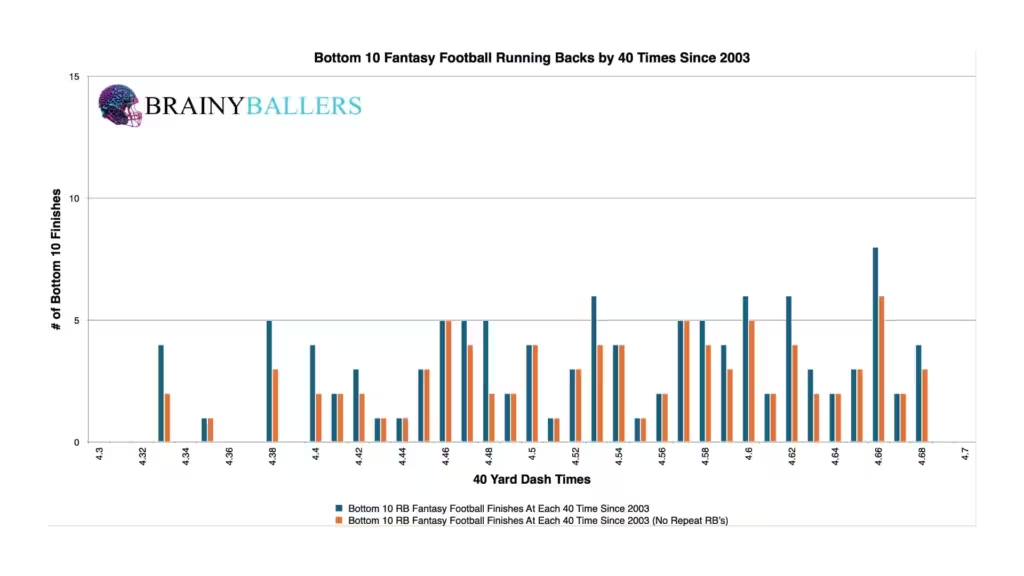
To visualize each 40 time, we segmented top and bottom 10 RBs by 40 times in a 0.01-second incremental chart. As you can see when comparing, the top 10 chart looks more unimodal and weighed towards lower 40 times. This further validates the trend that lower 40 times could correspond to a higher fantasy output.
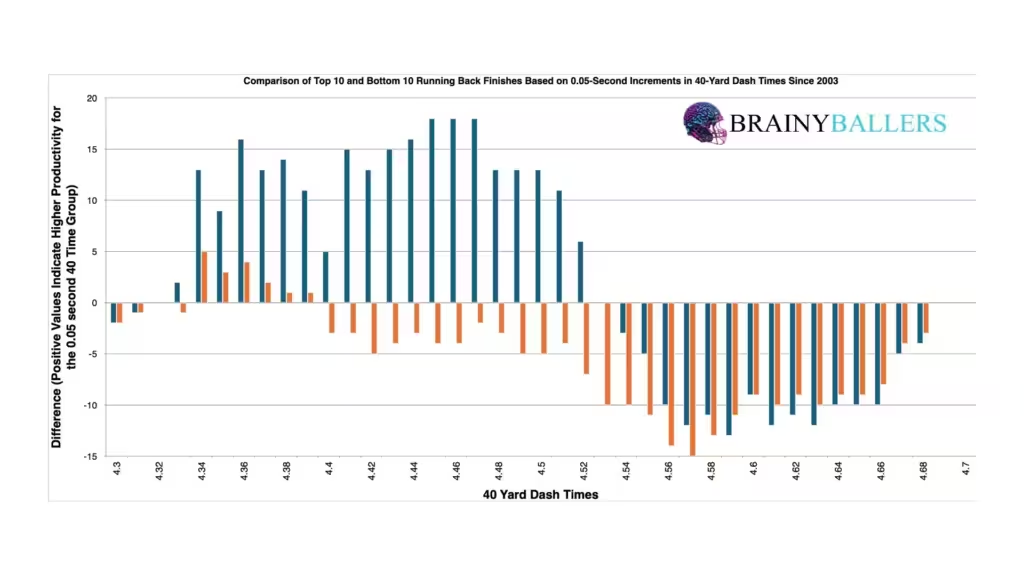
We combined the segmented charts to find a threshold where increased performances can be predicted. The chart’s desired outcome is a negative number for unique differences (Orange) and a positive number for non-unique differences (Blue). This would indicate consistent top level performance. The purpose of this chart is to find a threshold, or range, by adding the next 0.05 seconds to each 40 time value seen in the chart. This chart provided a clear and obvious result. As you can see in the chart, There is a clear increase from 4.33 to 4.52. After that, the opposite is true for 4.54 through the end of the chart. Therefore, including the next 0.05 seconds, 4.57 and below became our 40 time threshold. Even with more unique values in the top 10 between 4.34 and 4.39, it is too unimodal for the non-unique values to count these out. Therefore, 4.57 and below will be the subject of this analysis going forward.
We wanted to see if we found just an average RB time, or if we found the average 40 time of a top performing back. Then we found the percentage of bottom 10 RBs who had a 4.57 and below 40 time. After that, we compared it to the top 10. For the bottom 10, there were 120 running backs who ran the 40 yard dash at the combine. Out of that 120, 68 clocked in at or under 4.57 seconds, accounting for 56.7%. This baseline comparison set the stage for contrasting to top-performing running backs to gauge the significance of this threshold. From 2003-2023, 111 of 137 top 10 RB finishers (81.0%) fell within the 4.57-second threshold. This 24.3% increase signals a new high out of all of our RB data found thus far.
We now wanted to test different ranges close to our previously identified threshold to see if there is actually a higher producing range. What we found was an even higher elite producing threshold: 4.57 seconds and under. This threshold occurs at a 28.0% higher frequency in the top 10 versus the bottom 10. This will be the subject of our study going forward.
Due to these findings, BMI could play a factor in our Star-Predictor Score (SPS) model. The Star-Predictor Score (SPS) is a scouting tool designed to maximize investment potential and reduce risks when drafting rookies in Fantasy Football. It is proven to have a higher accuracy than draft capital alone to predict fantasy success. The SPS includes 13 to 17 metrics, with the exact number varying by the player’s position. All these metrics are pre-NFL, and some are invented by us, providing a complete analysis of a player’s analytical profiles. The SPS gained widespread notoriety for its high accuracy, having made it on Barstool and The Pat McAfee Show. The SPS can be found here.
We further wanted to break this threshold down between the last two decades in the chart below. As you can see, The 40 time threshold is consistently more common among top finishers, especially in the last decade. This recent trend further validates us including this in our prospect scoring system for predicting RB success.
| 2004-2013 | |||
| Top 10 | 11 through 40 | Bottom 10 | |
| All count | 59 | 158 | 52 |
| At or under 4.55 | 50 | 95 | 32 |
| % (hard zone/all) | 84.7% | 60.1% | 61.5% |
| 2014-2023 | |||
| Top 10 | 11 through 40 | Bottom 10 | |
| All count | 74 | 203 | 64 |
| At or under 4.55 | 55 | 116 | 28 |
| % (hard zone/all) | 74.3% | 57.1% | 43.8% |
We ran each 40 time against their corresponding fantasy points since 2003 through a standard statistical test. Those results were extremely clear and obvious.
This shows strong correlation between fantasy points and 40-times. We are hoping for a minimum of 0.1, or an inverse correlation maximum of -0.1 while studying world-class athletes as we are. For reference to something that everyone acknowledges matters in prospect scouting, and to show the accompanying Pearson value, RB draft capital prevailed a -0.234 Pearson value.
We went through all the RB’s since 2003 and found all RB’s who fell into all of our metrics findings which are: height range, weight range, BMI threshold, and the newfound 40 time threshold. Here’s the list:
| Name | Top 10 finishes |
| Rachaad White | 1 |
| Melvin Gordon III | 3 |
| Todd Gurley II | 3 |
| Darren McFadden | 1 |
| Matt Forte | 5 |
| Ryan Grant | 1 |
| Adrian Peterson | 6 |
| Justin Fargas | 0 |
That comes out to 8 Names, 7 of which had at least 1 top 10 finish. Across these 7 names, there was 20 top 10 finishes. Including one who we love due to his near unpredictable rise to success:
One standout from this elite list is Ryan Grant. Grant was an undrafted player who defied the odds and had a top 10 finish. Despite his one-hit wonder story, his inclusion in this elite group showcases the power of predictive analytics and the potential to unearth hidden gems and undervalued talents. This further gets us extremely excited to formulate a scoring system based on the findings surrounding this list of elite players.
We wanted to have one last bit of fun, so we looked into what the average and median times across all of our data. Both the average and median was 4.52 seconds.
What 3 metrics matter the most when scouting a rookie Quarterback? What threshold should Quarterbacks achieve within those metrics to be considered an elite prospect? How much should you value those stats above all other stats? Couldn't answer those questions? Rest easy, we have it handled for you. That's what this chart answers. Sort by importance and/or filter by position. Unlock by signing up with the links provided. $9.99/Year or $24.99 Lifetime access. Cancel anytime.
As we continue looking into RB analytics, the spotlight now shines on the 4.57-second threshold in the 40 yard dash. This finding came back as the most significant range or threshold amongst all of our RB data. Additionally, our regression testing yielded exceptionally promising results with a Pearson value of -0.193.
Our series has always sought to push the boundaries of sports analytics, and this latest installment reaffirms our commitment to uncovering the hidden dynamics that define the game. Every Saturday We will dive deep into the most intriguing questions, bust myths, and settle debates with thorough analysis similar to this. We thrive on curiosity and welcome your input — so please, leave comments or reach out to us with topics you’re eager to see dissected next. All of our research can be found on our Analytics Page. Up next on our agenda for Part 11 of “Does It Matter?” is our next examination of NFL Running Backs: Does RAS matter? If so, what’s the RAS threshold necessary for success? Mark your calendars; every Saturday we shed light on the topics that matter to you. All it takes is a quick question being asked and we will go to work for you!


For our 61 part “Does It Matter?” series, we looked into whether a Wide Receiver’s College Yards After Catch per Reception (YAC/Rec)

In part 60 of our “Does It Matter?” series, we dove into the question of whether a college Wide Receiver’s career Average
The “Does It Matter?” series, part 59 looked to uncover the role of a quarterback’s rookie touchdown per game (TD/G) in predicting
