
Can Draft Capital Help Predict Tight End Success?
In our 63-part analytical series, “Does It Matter?”, we next wanted to look into the intriguing question of whether a Tight End’s


For Part 23 of our “Does It Matter?” series, we investigated whether Relative Athletic Score (RAS) can be a predictor of success for NFL Tight Ends in fantasy football. Our findings resulted in an optimal range and successful correlation using standard statistical analysis. Here are all of our methodology and findings.
Relative Athletic Score (RAS) is a metric used to evaluate the athleticism of NFL prospects based on their performances in Combine and Pro Day drills. Developed by Kent Lee Platte in 2013, RAS takes various physical attributes such as speed, agility, explosiveness, and size to normalize them on a scale from 0 to 10. The results are then color-coded to provide a quick visual comparison of a player’s athletic traits relative to other players of the same position. This system helps teams and analysts quickly assess the athletic potential of prospects. Us at BrainyBallers have used RAS religiously in evaluating talents.
To begin, we focused solely on the top 50 fantasy football TEs each season since 2003. PPR (Points Per Reception) fantasy scores were used to accumulate these leaderboards. Within this article, you will see the phrase “bottom 10.” This is defined as the fantasy finishers ranked 41st-50th each season. Further, all the RAS values in this article will be rounded to the nearest tenth (0.1).
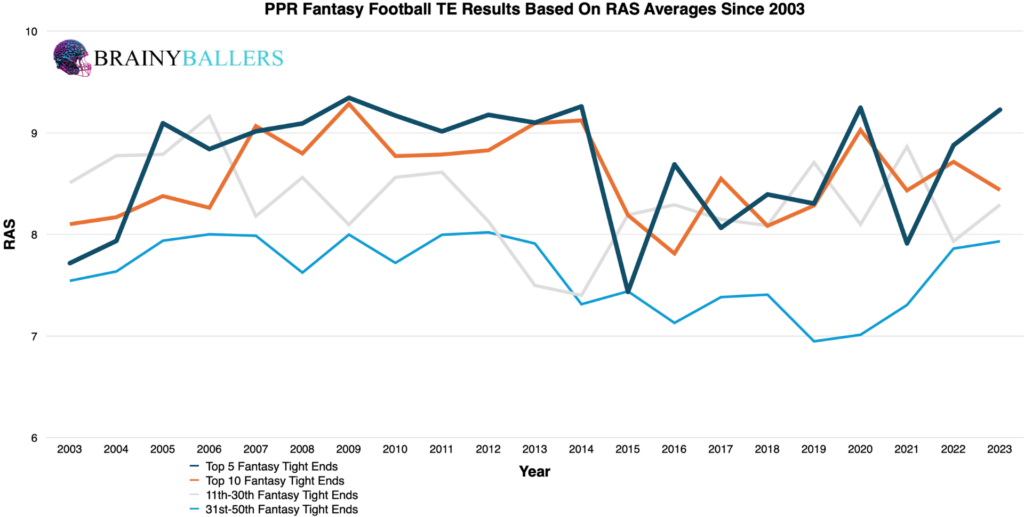
To help begin identifying trends, we collected data for four groups, averaging their RAS scores over 21 seasons. The four groups are as follows:
After charting the averages for these groups, a clear pattern emerged. The top-producing TEs (Top 5) consistently had higher RAS scores compared to the 31st-50th place finishers for each of the last 21 seasons. This strongly suggests that higher RAS scores are more prevalent among top-performing TEs, and that correlation may be the result of this research.
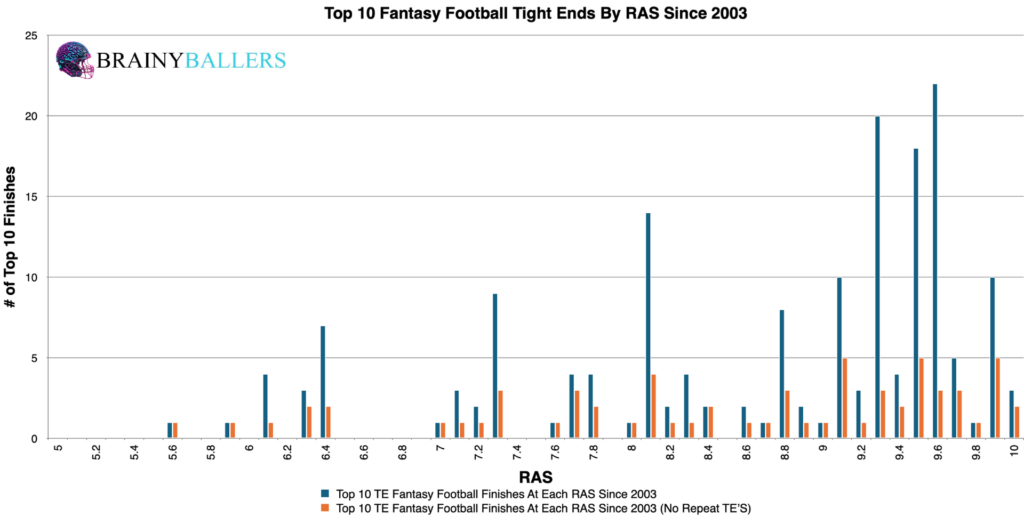
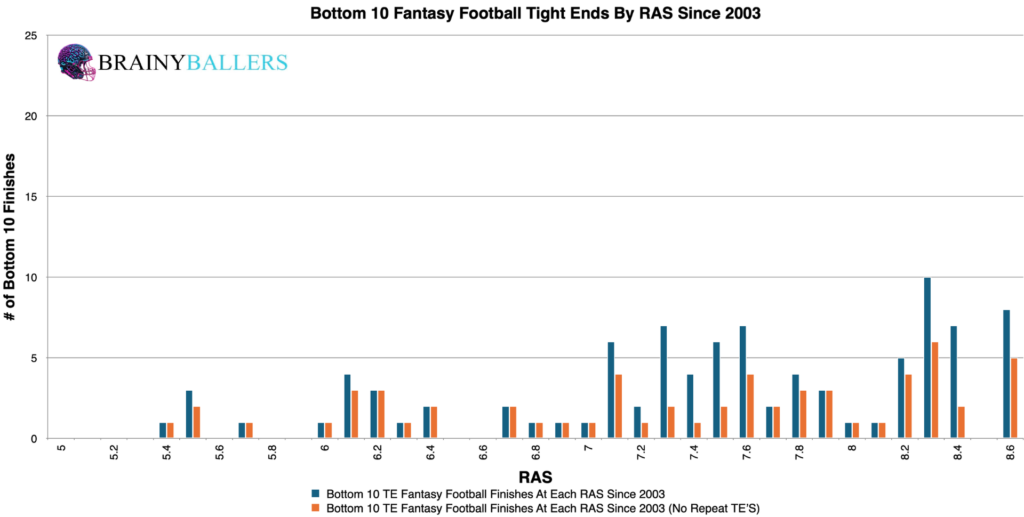
To further refine our analysis, we segmented the top and bottom 10 finishers since 2003 into 0.1 RAS increments. The results appeared to reveal that higher RAS scores show up more frequently within the top 10 than in the bottom 10. You can see this from the clustering of top 10 scores around the higher RAS’s. Whereas in the bottom 10 it is more evenly distributed.
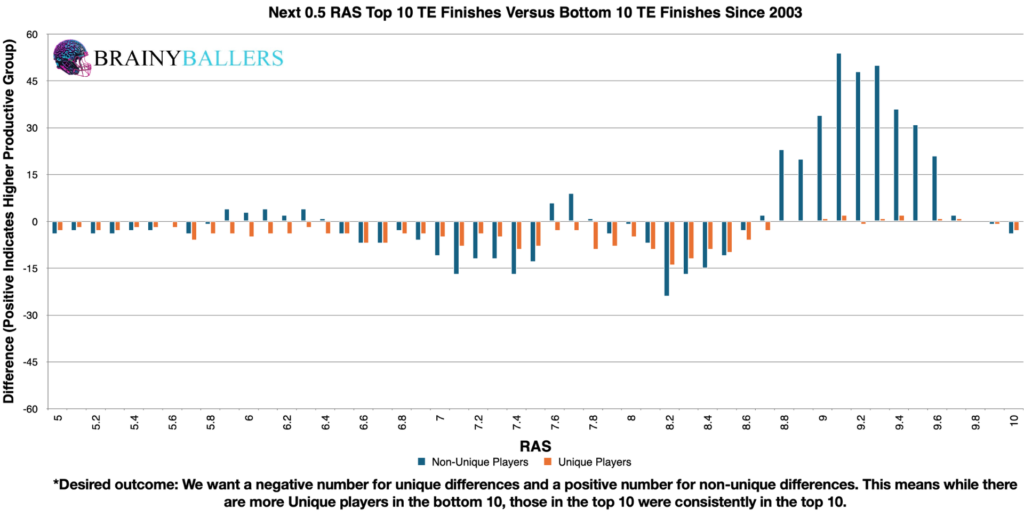
Our primary focus was to find a RAS range where performance significantly increases and where fewer unique players appear in the top 10, which would indicate consistent excellence. To achieve this, we created a differences chart that compared each RAS and the next 0.5-RAS by subtracting the bottom 10 results from the top 10 results for each range. The chart’s desired outcome is a negative number for unique differences (Orange) and a positive number for non-unique differences (Blue). This would indicate the desired consistent top level performances we are hoping for. This chart allowed us to get closer to the most optimal performance range, which appears to be 8.8 RAS and above. Therefore, we are going to look deeper into the 8.8 and above RAS range next to try to verify whether it is the optimal range.
To verify our findings, we looked at this identified RAS range (8.8 and above) and applied it to TEs who finished in the bottom 10 since 2003. Out of 169 TEs, 52 had a RAS of 8.8 and above, accounting for 30.8%. This percentage served as our baseline to distinguish whether this is an average TE RAS, or if this is an average top-performing TE RAS.
With our baseline set, we now will examine all the top 10 finishers between 2003 and 2023. If more than 30.8% occur in the top 10, then we found an average top-performing TE. So here it is: Among 176 top 10 finishers, 107 had a RAS of 8.8 and above, representing 60.8%. This comparison revealed a substantial 30% increase, suggesting that the RAS of 8.8 and above could in fact be a predictor of a top-performing TE, rather than just an average one.
To ensure the accuracy of our findings, we upgraded our spreadsheet to allow for quick adjustments so we can test various ranges close to the 8.8 threshold identified from our differences chart. During this process, we found that altering this range to 8.8 to 9.9 RAS prevailed the final optimal range. This range occurred at a 32.5% higher frequency in the top 10 than in the bottom 10. Therefore, this will be the subject of this research going forward.
Due to these findings, RAS could play a factor in our Star-Predictor Score (SPS) model. Since 3.76 RAS is the lowest seen since 2003 in the top 10, this will be the critical value for the SPS. The Star-Predictor Score (SPS) is a scouting tool designed to maximize investment potential and reduce risks when drafting rookies in Fantasy Football. It is proven to have a higher accuracy than draft capital alone to predict fantasy success. The SPS includes 13 to 17 metrics, with the exact number varying by the player’s position. All these metrics are pre-NFL, and some are invented by us, providing a complete analysis of a player’s analytical profiles. The SPS gained widespread notoriety for its high accuracy, having made it on Barstool and The Pat McAfee Show. The SPS can be found here.
Our findings were also backed by strong statistical evidence:
This Pearson Value indicates no significant correlation. We are hoping for a minimum of 0.1, or an inverse correlation maximum of -0.1 when we study world-class athletes as we are. For reference to something that everyone acknowledges matters in prospect scouting, and to show the accompanying Pearson value, RB draft capital prevailed a -0.234 Pearson value.
Using our data, we classified athletes into three groups: the top 10, 11-40th place finishers, and the bottom 10. We then applied our identified optimal RAS range and compared its occurrence across the last two decades. Our aim was to see whether this range has been more, or less, influential in recent times. As you can see, in the most recent decade, there was a 13.4% increase in the rate where our optimal RAS range showed up in the top 10 more than in the bottom 10 when compared to earlier decades. This suggests an increased significance of RAS in predicting top Tight End performance.
| 2004-2013 | |||
| Top 10 | 11 through 40 | Bottom 10 | |
| All count | 79 | 235 | 77 |
| All 8.8 to 9.9 RAS | 47 | 99 | 22 |
| % (Optimal Range/all) | 59.5% | 42.1% | 28.6% |
| 2014-2023 | |||
| Top 10 | 11 through 40 | Bottom 10 | |
| All count | 91 | 255 | 85 |
| All 8.8 to 9.9 RAS | 55 | 99 | 20 |
| % (Optimal Range/all) | 60.4% | 38.8% | 23.5% |
What 3 metrics matter the most when scouting a rookie Quarterback? What threshold should Quarterbacks achieve within those metrics to be considered an elite prospect? How much should you value those stats above all other stats? Couldn't answer those questions? Rest easy, we have it handled for you. That's what this chart answers. Sort by importance and/or filter by position. Unlock by signing up with the links provided. $9.99/Year or $24.99 Lifetime access. Cancel anytime.
Our data-driven approach provided evidence that RAS scores are a significant predictor of fantasy football success for NFL Tight Ends. We concluded that a RAS of 8.8 to 9.9 is the optimal range for NFL TEs. With regression testing support and the increasing importance across the last two decades, RAS absolutely should be taken into account when evaluating Tight End prospects for your Fantasy Football teams.
Our series has always sought to push the boundaries of sports analytics. This latest installment reaffirms our commitment to uncovering the hidden dynamics that define the game. Every Saturday, we’ll dive into intriguing questions, bust myths, and settle debates with thorough analysis. We welcome your input. Therefore, please leave comments or reach out with topics you’re eager to see dissected. Premium Analytics subscribers get priority. All of our research can be found on our Analytics Page. Up next on our agenda for Part 24 of “Does It Matter?” is an examination of RB Rush Yards Over Expected (RYOE): Does it matter? If so, what’s the RYOE threshold necessary for RB success? Mark your calendars; every Saturday we shed light on the topics that matter to you. If you’re a Premium Analytics subscriber, all it takes is a quick question being asked and we will go to work for you!


BrainyBallers Buy-Hold-Sell Chart (All Players)
Get Your Order 100% Refunded By Predicting The Next SuperBowl Winner!
In our 63-part analytical series, “Does It Matter?”, we next wanted to look into the intriguing question of whether a Tight End’s

For our 61 part “Does It Matter?” series, we looked into whether a Wide Receiver’s College Yards After Catch per Reception (YAC/Rec)

In part 60 of our “Does It Matter?” series, we dove into the question of whether a college Wide Receiver’s career Average
