
Can College Yards After Catch Help Predict NFL Success For Wide Receivers?
For our 61 part “Does It Matter?” series, we looked into whether a Wide Receiver’s College Yards After Catch per Reception (YAC/Rec)


For the 27th installment of our “Does It Matter?” series, we set out to determine whether a Running Back’s draft capital can predict their NFL success. From this, we found an optimal threshold that correlates to NFL success. Here are all of our findings:
To conduct our analysis, we examined the top 50 fantasy football running back finishers from each year since 2003 using PPR (points per reception) fantasy scoring. Since our data had undrafted free agents, we assigned them the highest draft pick in their respective draft year plus 1 in our dataset. In other words, “Mr. Irrelevant” plus 1.
The “bottom 10” term, which you will see throughout this study, refers to running backs who finished 41st-50th each season in fantasy rankings.
Why the top 50? The reason we chose the top 50 is to find a happy medium. We don’t want to go further than the top 50 and start getting close to the fringe roster members whom obviously are not going to score top 10. These players could therefore just weigh the data. On the other hand, We want to compare the worst to the best still. Comparing the top 10 to the 11th place finisher, or an average number that takes into account the 11th place finisher, doesn’t satisfy our personal itch to try to find trends.
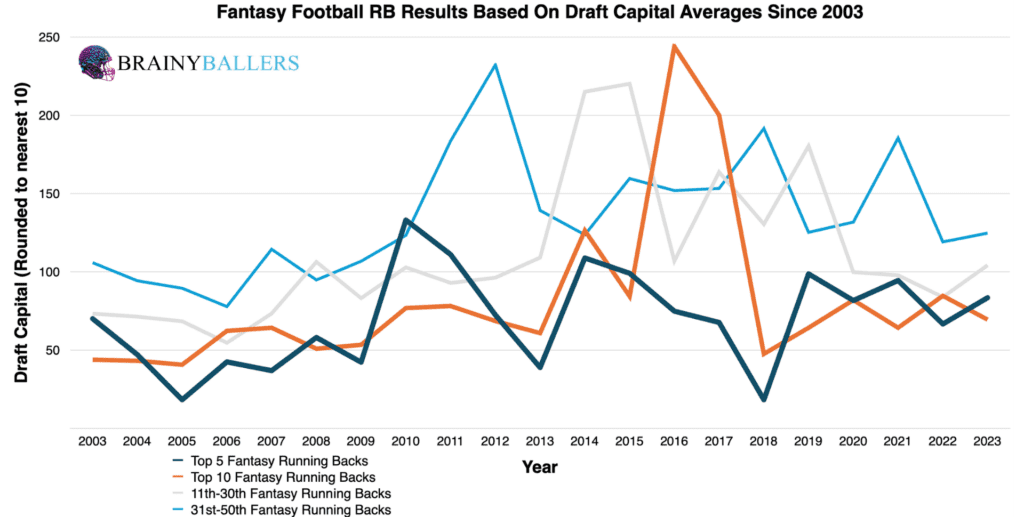
By separating all top 50 finishers since 2003 into 4 different groups and averaging each group, we hoped to unveil any correlations between draft capital and fantasy success. One of our tool to achieve this was our averages chart. This broke down the top 50 fantasy football finishers into four groups:
By comparing these groups in the chart, it quickly became evident that lower draft capital players are more prevalent among top-producing running backs. Specifically, in 20 out of 21 seasons (95.2%), the top 10 running backs had equal, or lower, draft capital compared to those finishing between 31st and 50th.
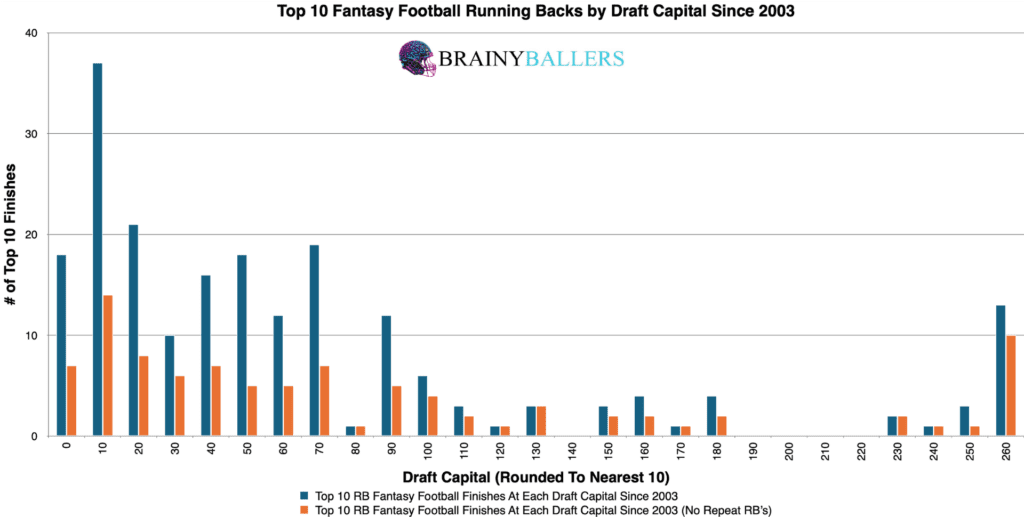
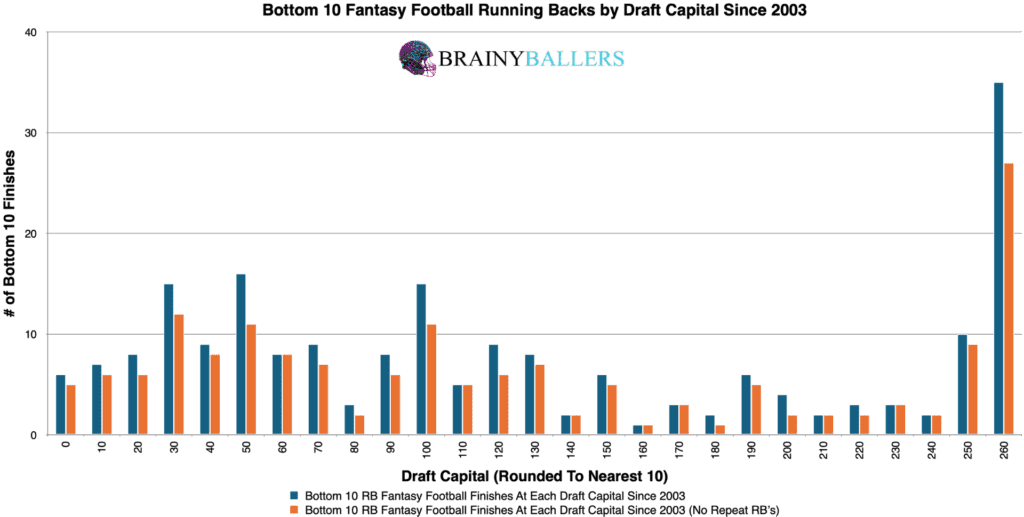
We next analyzed the draft capital of top 10 finishers since 2003, breaking it down into 10 overall pick increments. By charting this data, we observed that running backs drafted within the earlier rounds are more likely to appear in the top 10 fantasy producers, as we had expected. The top 10 and bottom 10 charts can be seen blow, with the top 10 coming first:
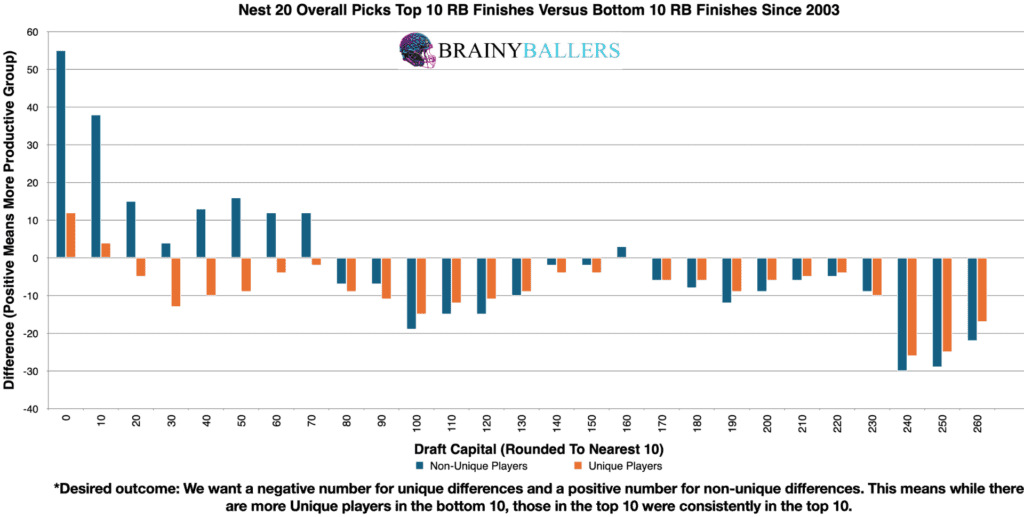
To determine a draft position range, or threshold, which is the most advantageous for predicting high-performing running backs, we created our differences chart. This compares each overall pick plus the next 20 picks, and subtracting the bottom 10 results from the top 10. The chart’s desired outcome is a negative number for unique differences (Orange) and a positive number for non-unique differences (Blue). This would indicate the desired consistent top level performances we are hoping for. The insights we got from this chart indicated that the 70th overall pick and below appeared to be the highest performing threshold. Next, we will go through a process to verify whether this is our optimal range or not.
To substantiate our differences chart findings, we compared this threshold to all RBs who finished in the bottom 10 since 2003. Upon doing this, we noted that of 208 RBs, 78 were picked 70th overall or lower, accounting for 37.5%. This figure established our baseline for comparison to the top 10, which we will compare next.
We then examined RBs who finished in the top 10 from 2003-2023. Out of 210 top 10 finishers, 151 were drafted 70th overall or lower, representing 71.9% of the total. This reflects a significant 34.4% increase compared to our baseline. This suggested that the 70th overall pick or lower might indeed be the ideal threshold for predicting top-performing RBs.
To ensure thorough validation, we upgraded our spreadsheet to quickly adjust and test various draft pick ranges. This allowed us to efficiently identify the threshold producing the highest percentage of top 10 finishes. By testing numbers close to the initially identified range, we discovered that extending the threshold to the 90th overall pick and below yielded a 35.3% higher top 10 appearance rate compared to the bottom 10. This fine-tuning process indicated that the 90th overall pick represented an even more optimal threshold for producing top-performing RBs. Therefore, the 90th overall pick (rounded to nearest 10) and below will be the subject of this research going forward.
Due to these findings, draft capital probably will play a factor in our Star-Predictor Score (SPS) model. Since UDFA is the lowest seen since 2003 in the top 10, there will be no critical value for the SPS in regards to draft capital. The Star-Predictor Score (SPS) is a scouting tool designed to maximize investment potential and reduce risks when drafting rookies in Fantasy Football. It is proven to have a higher accuracy than draft capital alone to predict fantasy success. The SPS includes 13 to 17 metrics, with the exact number varying by the player’s position. All these metrics are pre-NFL, and some are invented by us, providing a complete analysis of a player’s analytical profiles. The SPS gained widespread notoriety for its high accuracy, having made it on Barstool and The Pat McAfee Show. The SPS can be found here.
Our statistical analysis revealed great insights into the relationship between RB’s draft capital and their fantasy production:
This Pearson Value indicates strong correlation between draft capital and future fantasy points. We are hoping for a minimum of 0.1, or an inverse correlation maximum of -0.1 when we study world-class athletes as we are. For reference to something that everyone acknowledges matters in prospect scouting, and to show the accompanying Pearson value, QB draft capital prevailed a -0.219 Pearson value.
To spot calandar trends in draft capital, we compared decades. We particularly focused on these following groups for this breakdown:
Our findings showed no trend differences between the most recent decade and the earlier one. The occurrence rate of our identified optimal draft capital threshold was similar in both periods, with only a 1.0% difference in the rate where the optimal range appeared in the top 10 more frequently than in the bottom 10.
| 2004-2013 | |||
| Top 10 | 11 through 40 | Bottom 10 | |
| All count | 100 | 299 | 98 |
| All 95 overall and below | 85 | 181 | 48 |
| % (Optimal Range/all) | 85.0% | 60.5% | 49.0% |
| 2014-2023 | |||
| Top 10 | 11 through 40 | Bottom 10 | |
| All count | 100 | 300 | 100 |
| All 95 overall and below | 70 | 145 | 35 |
| % (Optimal Range/all) | 70.0% | 48.3% | 35.0% |
*Predict the 2026 Super Bowl winner on the product page for a full refund! No catches or extra fees to participate!* What 3 metrics matter the most when scouting a rookie Quarterback? What threshold should Quarterbacks achieve within those metrics to be considered an elite prospect? How much should you value those stats above all other stats? Couldn't answer those questions? Rest easy, we have it handled for you. That's what this chart answers. Sort by importance and/or filter by position. Unlock by signing up with the links provided. $9.99/Year or $24.99 Lifetime access. Cancel anytime.
From our number-crunching, one thing is clear: draft capital does indeed matter when predicting NFL success for running backs. Higher draft picks correlate with better fantasy football performances. Our analysis revealed that drafting RBs within the 95th overall pick and below substantially increases the likelihood of achieving top 10 finishes.
Our series has always sought to push the boundaries of sports analytics. This latest installment reaffirms our commitment to uncovering the hidden dynamics that define the game. Every Saturday, we’ll dive into intriguing questions, bust myths, and settle debates with thorough analysis. We welcome your input. Therefore, please leave comments or reach out with topics you’re eager to see dissected. All of our research can be found on our Analytics Page. Up next on our agenda for Part 28 of “Does It Matter?” is an examination of Defensive Backs Height: Does it matter? If so, what’s the height threshold necessary for NFL success? Mark your calendars; every Saturday we shed light on the topics that matter to you. All it takes is a quick question being asked and we will go to work for you!


BrainyBallers Buy-Hold-Sell Chart (All Players)
Get Your Products 100% Refunded By Predicting The Next SuperBowl Winner!
For our 61 part “Does It Matter?” series, we looked into whether a Wide Receiver’s College Yards After Catch per Reception (YAC/Rec)

In part 60 of our “Does It Matter?” series, we dove into the question of whether a college Wide Receiver’s career Average

The “Does It Matter?” series, part 59 looked to uncover the role of a quarterback’s rookie touchdown per game (TD/G) in predicting
