Running Backs: Can The Star-Predictor Score (SPS) Help Predict NFL Success?
For the 53rd entry in our “Does It Matter?” series, we explore how effectively the Running Back Star-Predictor Score (SPS), found here,


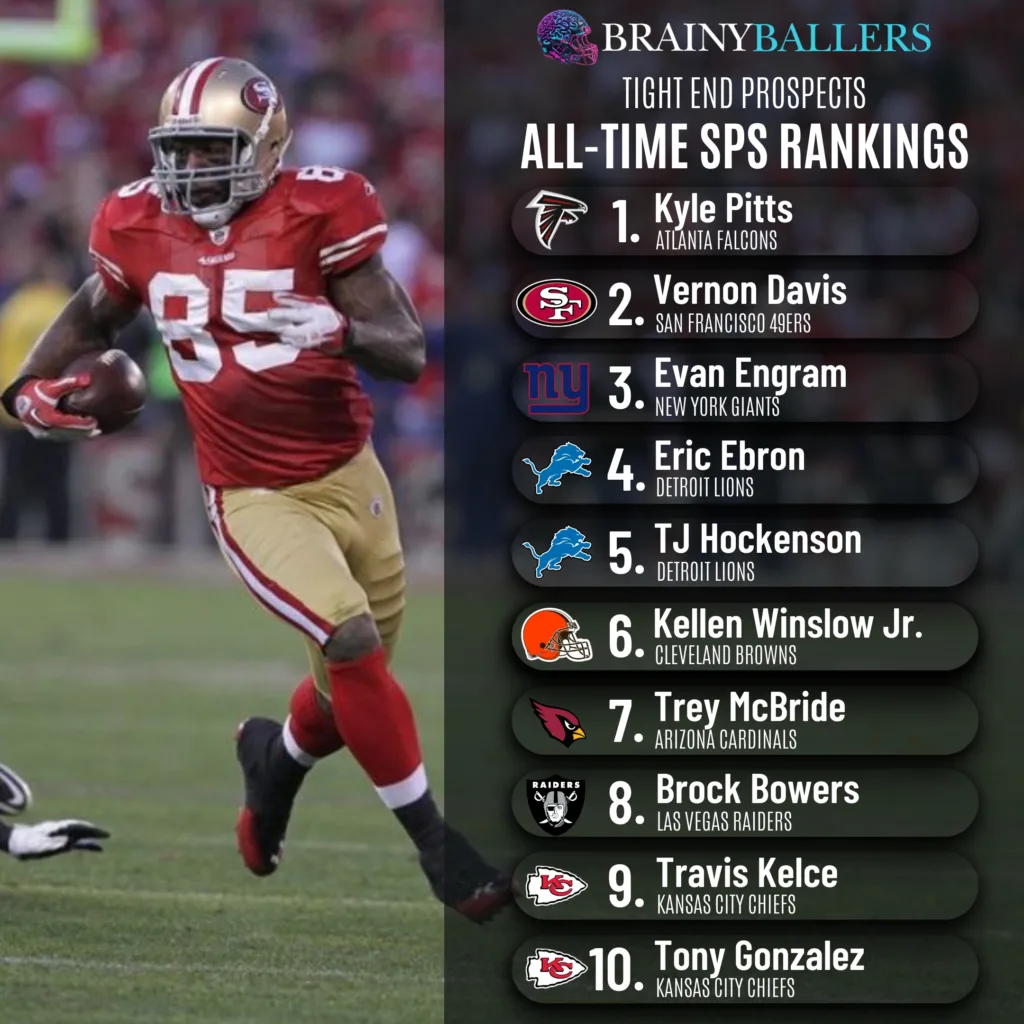
For the next entry into our now 54-part “Does It Matter?” series, we assessed whether the Tight Ends Star-Predictor Score (SPS), found here, can reliably forecast their future Fantasy Football success. while using it as a scouting tool. In this article, we looked at how predictive it is and identify a specific SPS range that is significantly more prevalent among top finishers compared to those at the bottom. Currently, there are 3 Hall Of Famers in the top 10 all time, 4 others with a history of success, and Trey McBride and Brock Bowers as the up-and-coming talent in the top 10. This article will guide you on how the SPS can help identify undervalued players and verify or challenge the public consensus of the star potential in top NFL Draft picks. Here are all of our findings:
The Star-Predictor Score (SPS) was built as a prospect scouting tool aimed at maximizing investment potential while minimizing risks when drafting rookies in Fantasy Football. Developed using data since 2003, the SPS formula was then applied to every drafted or undrafted free agent (UDFA) since then. From that, and out of a total of 387 Tight Ends, the following top 10 prevailed:
Our analysis of the Tight End SPS first focused on the top 50 fantasy football finishers since 2003, utilizing Points Per Reception fantasy scores. We then compared the coefficients of the SPS against Draft capital to determine which was more accurate in predicting career fantasy points. The Star-Predictor Score (SPS) for Tight Ends utilizes 13 distinct metrics from various sources to come together into one predictive model. It is presented in a percentile grading system, therefore the top player ever will have a 100.0 SPS grade.
Why only the top 50? We utilized this established methodology to accurately compare this metric with all the other metrics we have previously examined against the top 50. We selected the top 50 to maintain a “happy medium.” Going further than the top 50 would include fringe roster players who are unlikely to finish top 10 and therefore would potentially just skew the data. Conversely, we wanted to compare the worst to the best, necessitating a range of players distinctly different from the top 10. Therefore, we examined the 41st-50th place finishers for comparison with the top 10, which we will refer to as the “bottom 10” throughout this article.
Before the research, it’s important to note that the SPS excels with 1st-3rd round Tight Ends. Therefore, our table will only show them. A higher SPS means higher fantasy success potential. Green players are better prospects with higher success potential, and beyond them, the Fantasy Football success potential drops.
Brock Bowers is the most recent example. Coming into the NFL, he had an 81.4 SPS which placed him in the top 10 Tight End prospect all-time list. Going back two years before that – Trey McBride. With an SPS of 82.7, he also placed himself in the top 10 all-time TE SPS prospect list. There are some big swings (Kyle Pitts first and foremost), although the SPS has missed less than draft capital itself, which this article will detail.
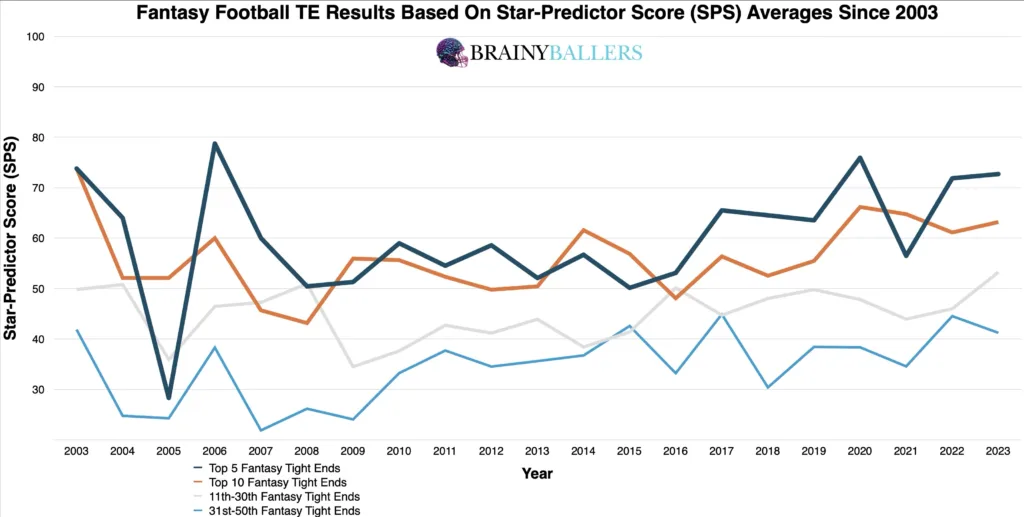
Our analysis began by creating an average chart for various tiers of finishers (top 5, 10, 11-30th, and 31-50th) since 2003. From this, a clear and very obvious trend emerged: higher SPS scores have always been associated with higher fantasy scores. As you can see, in every season since 2003, top 10 finishers consistently exhibited higher SPS scores than those in the 31-50th range, with an average margin of 21.42. This chart is typically great at indicating correlation or no-correlation metrics, like in the example with defensive end weights where no trend was visible in the averages chart, and weights ended up having zero correlation and therefore shouldn’t be used in scouting defensive ends. As for the SPS, the trend held firm over all 21 seasons, reinforcing the potential predictive power of the SPS.
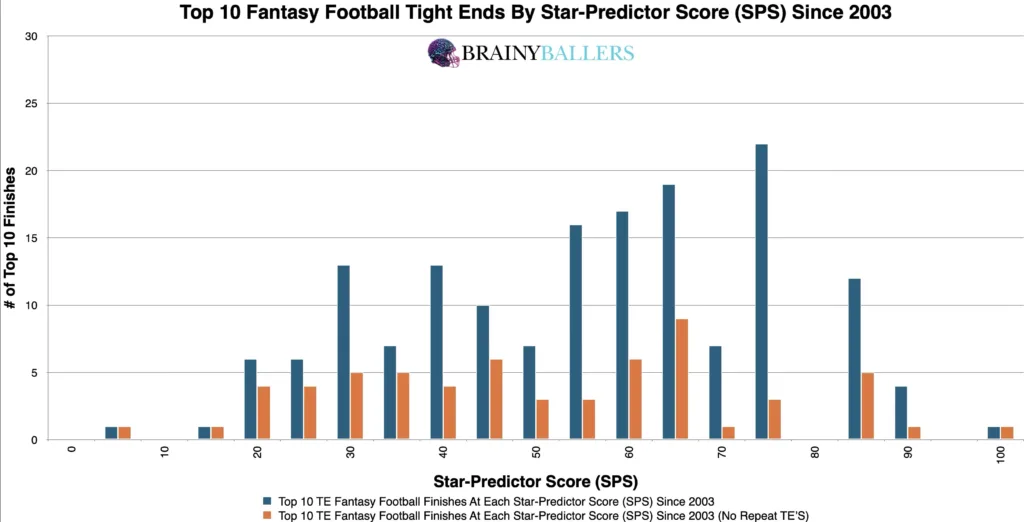
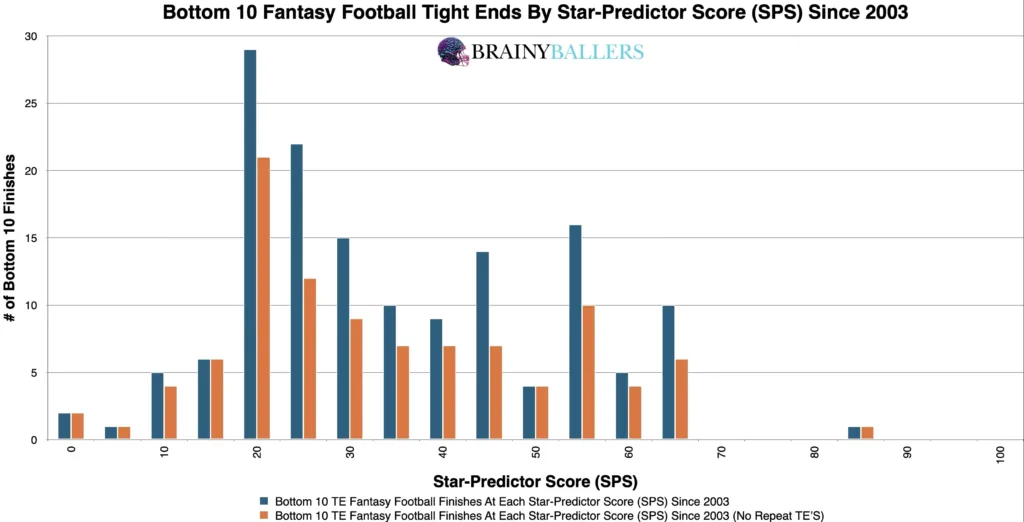
Additionally, we segmented out the top and bottom 10 finishers into every 5.0 rounded SPS grade since 2003 to get a more granular view. Once again, from this you can observe a clear correlation between higher SPS scores and elevated fantasy scores. You can see this correlation by comparing the weight and distribution of both charts, where you will see the top 10 first:
Our main goal was to pinpoint an applicable threshold that signifies top-level consistency and minimizes the appearance of unique performers. To do this, we developed a differences chart. This chart compared each Star-Predictor Score (SPS) with the next 5.0 SPS increment, subtracting the bottom 10 results from the top 10 within that group. The chart’s desired outcome is a negative number for unique differences (Orange) and a positive number for non-unique differences (Blue). This would indicate the top level consistency we are hoping for. The results indicated that a score of 55 or 60 and above is a possible range for top performers.
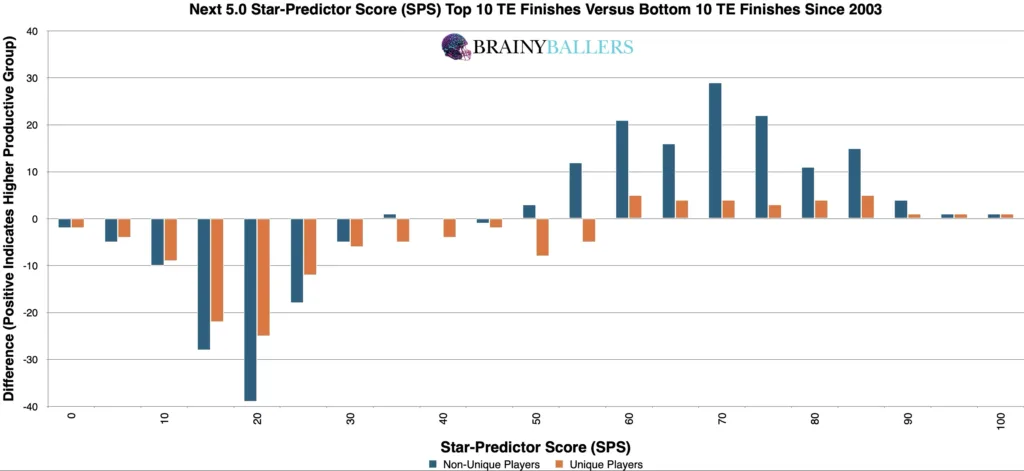
With these insights in hand, we made adjustments to the previously mentioned optimal range to ensure we have identified the highest-producing range. After testing numbers close to the identified range, we discovered that adjusting the range to 60.0 and above SPS increased the top 10 appearance rate by 35.1% compared to the bottom 10. This optimal range will therefore be the focus of our study and a benchmark for evaluating your favorite athletes. This range now stands as the ideal benchmark for evaluating top performers, and is what you should look for in prospects. Although this is great, the next question is now how much does this matter?
We next utilized standard statistical methods to attempt to validate or debunk our insights. When comparing the Pearson value of the SPS in relation to fantasy points since 2003, here are those findings:
This indicates a strong correlation between a TE’s Star-Predictor Score (SPS) and future fantasy production. For studying world class athletes as we are, a value greater than 0.1 or less than -0.1 is desirable. In our research, the highest correlation across 43 metrics we’ve studied for Tight Ends has been 0.272, related to Y/RR, with draft capital slightly lower at 0.270. Across all 4 of our positions that will soon be in the SPS table, that comes in 1st place of predictive ability, merely beating out the Quarterback SPS. Although, this appears to be in last place when using the eye check, due to Kyle Pitts being #1 all time. It’s still notable to point out that he was a draft capital miss just as much as he was an SPS miss. In first place using the eye check is Quarterbacks – releasing draft morning – which the eye check of the top 10 all-time is the best of all positions posted in the SPS table in our opinion.
For those curious about the correlation coefficient when comparing draft capital and career fantasy points, and then comparing SPS grades to career fantasy points, here it is:
Now going down to all players in rounds 1-3:
As you can see, the gap of the significance difference closes when including the 3rd rounders, although it’s still more predictive. This gap continued to dwindle when including more rounds, although the SPS was still slightly more predictive than draft capital for all rounds and all UDFA since 2003. This is the reason only the top 3 NFL rounds will be published, with extra insights coming through rankings, social media, etc. Explaining the Pearson Value: Positive and negative Pearson values can be equally significant but in opposite ways. In the SPS example seen above, lower (higher value) overall draft capitals suggest a high probability of fantasy scoring, while higher SPS grades strongly indicate a higher fantasy score probability – and in a more significant way than the draft capitals do.
To further validate our findings, we compared data across the last two decades to identify whether this is a growing or dying trend. Specifially, we looked at the optimal TE SPS score range for top 10, 11-40th place finishers, and bottom 10. The analysis revealed that the optimal range is showing an increasing trend in the most recent decade as seen by comparing the bottom 10 to the top 10 in both decades (blue).
| 2004-2013 | |||
| Top 10 | 11 through 40 | Bottom 10 | |
| All count | 72 | 181 | 61 |
| All 60 and above | 22 | 36 | 1 |
| % (Optimal Range/all) | 30.6% | 19.9% | 1.6% |
| 2014-2023 | |||
| Top 10 | 11 through 40 | Bottom 10 | |
| All count | 89 | 276 | 87 |
| All 60 and above | 48 | 67 | 12 |
| % (Optimal Range/all) | 53.9% | 24.3% | 13.8% |
As far as the SPS table itself, users can filter and search data efficiently by applying parameters such as year, position, name, SPS scores, or colleges. The green cells in both SPS columns shows that the player is within the optimal range for future success chances. If you’re in green, you’re atop the bellcurve, with 100 being at the very top of the bell curve. The yellow indicates where the performance likelihood decline starts and transitions to red to indicate the players who are on the exponentially declining sides of the bellcurve. These tools and capabilities make it an invaluable asset for evaluating Tight End performances and finding sleepers or comparing player analytical profiles and future outlooks.

Our exploration into the SPS metric revealed its potential as a valuable tool in evaluating Tight End talents. The higher prevalence of higher SPS scores among top performers showcases its predictive significance. This information is not only crucial in distinguishing between two players but also in finalizing judgments on individual talent prospects. A 60 or higher SPS grade is our benchmark for identifying top future TE talent.
What metric matters the most when scouting a rookie Running Back? What threshold should Running Backs achieve within that metric to be considered an elite prospect? How much should you value that stat above all other stats? Couldn't answer those questions? Rest easy, we have it handled for you. That's what this chart answers. Sort by importance and/or filter by position. Unlock by signing up with the links provided. $9.99/Year or $24.99 Lifetime access. Cancel anytime.
Our series has always sought to push the boundaries of sports analytics. This latest installment reaffirms our commitment to uncovering the hidden dynamics that define the game. Every Saturday, we’ll dive into intriguing questions, bust myths, and settle debates with thorough analysis. We welcome your input. Therefore, please leave comments or reach out with topics you’re eager to see dissected. All of our research can be found on our Analytics Page. Up next on our agenda for Part 55 of “Does It Matter?” is an examination of Quarterback Star-Predictor Score (SPS): Does it matter? If so, what’s the SPS threshold necessary for NFL success? Mark your calendars; every Saturday we shed light on the topics that matter to you. All it takes is a quick question being asked and we will go to work for you!
Support these analytics and unlock our Ultimate Athlete Blueprints, where all of our research comes together in one table for all positions. $10 lifetime access.

BrainyBallers Buy-Hold-Sell Chart (All Players)
Make Money on BrainyBallers’ (Or anyone’s) content if it turns out to be incorrect!
Get Your Products 100% Refunded By Predicting The Next SuperBowl Winner!
For the 53rd entry in our “Does It Matter?” series, we explore how effectively the Running Back Star-Predictor Score (SPS), found here,

In Part 53 of our “Does It Matter?” series, we explored the predictive power of a quarterback’s top college yardage season on
For part 52 of our “Does It Matter?” series, we looked into whether a Quarterback’s NFL success can be predicted by their
