Jaxson Dart: The Next Household Name Quarterback
Jaxson Dart’s journey into the spotlight of the Big Apple began in the town of Kaysville, Utah. Born here, his early years


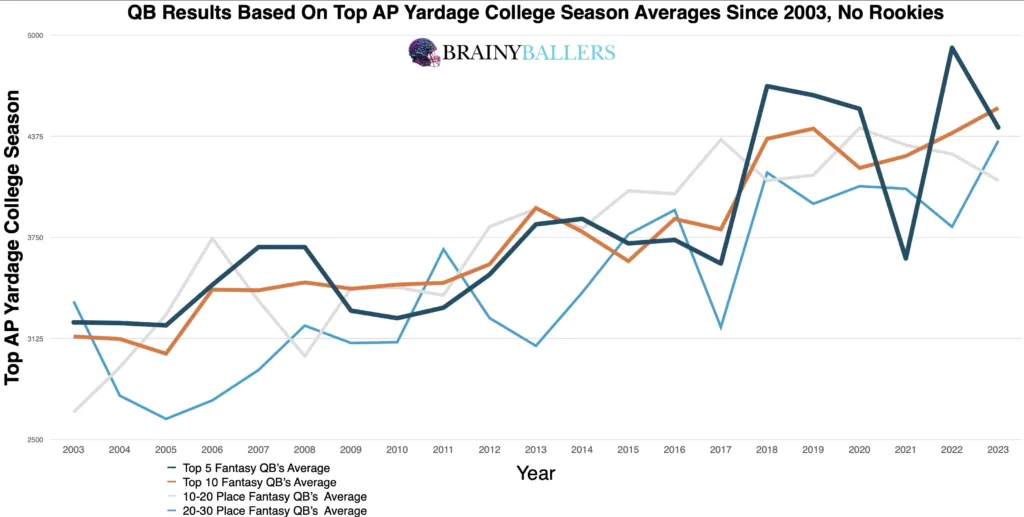
In Part 53 of our “Does It Matter?” series, we explored the predictive power of a quarterback’s top college yardage season on NFL success. We found a threshold which you should hope your favorite athletes to achieve, and applied standard statistical methods. Here are all of our findings:
To structure our study, we collected data of the top 30 fantasy football finishers since 2003. We removed rookie seasons to not allow for the typical rookie struggle amongst quarterbacks to skew our data. Throughout this study, you will see the term “bottom 10”, which is defined as the fantasy finishers ranking 21st-30th each season. Most data seen in here is rounded to the nearest 100 yards. Further, all Quarterback college yards are All-Purpose yards specifically, which could help not prioritize immobile pocket passing quarterbacks over dual-threat quarterbacks. As you may notice throughout this study, we used the top college yardage season by a QB as their data entry, not their college career yardage total.
We evaluated the averages of NFL finishers split into four groups: top 5, top 10, 11th-20th, and 21st-30th from 2003 onwards. This allowed us to spot any obvious patterns related to their top yardage season from college. This analysis showed that quarterbacks with higher college yardage seasons typically ended up with higher fantasy scores. As you can see, 16 out of 21 seasons (76.2%) the top 5 finishers had equal or higher college AP Yardage seasons compared to those finishing within the 21st-30th range. This suggests that higher AP Yardage seasons at the college level typically translates to better performances at the professional level.
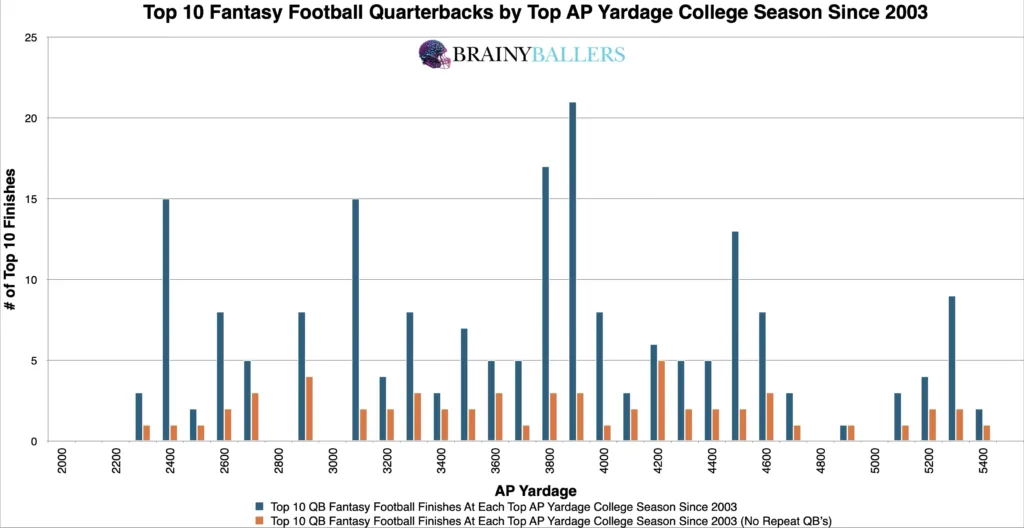
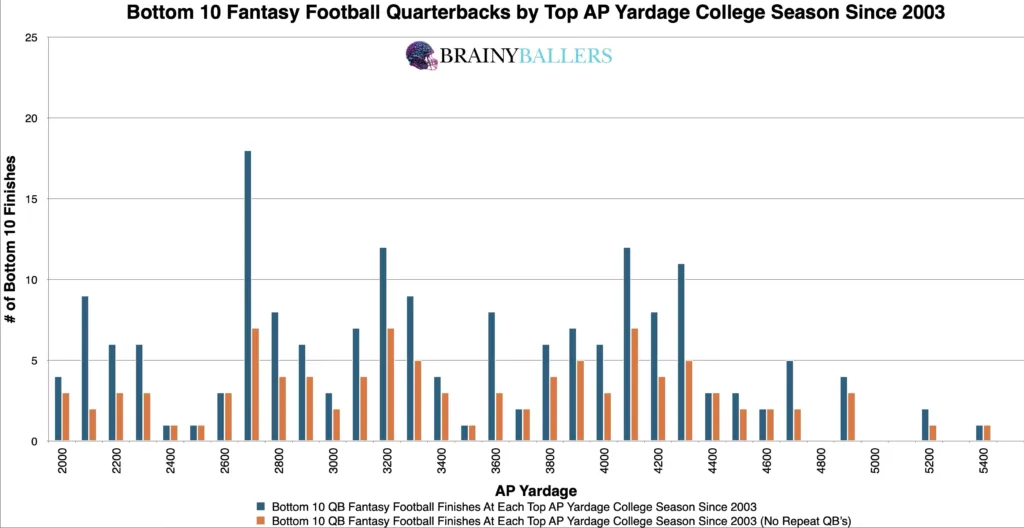
To begin looking deeper, we segmented the top and bottom 10 finishers by 100-yard increments. The outcome from this was clear: quarterbacks with higher college yardage seasons tended to outperform other Quarterbacks. This correlation emphasizes the significance of a quarterback’s production on their NFL potential.
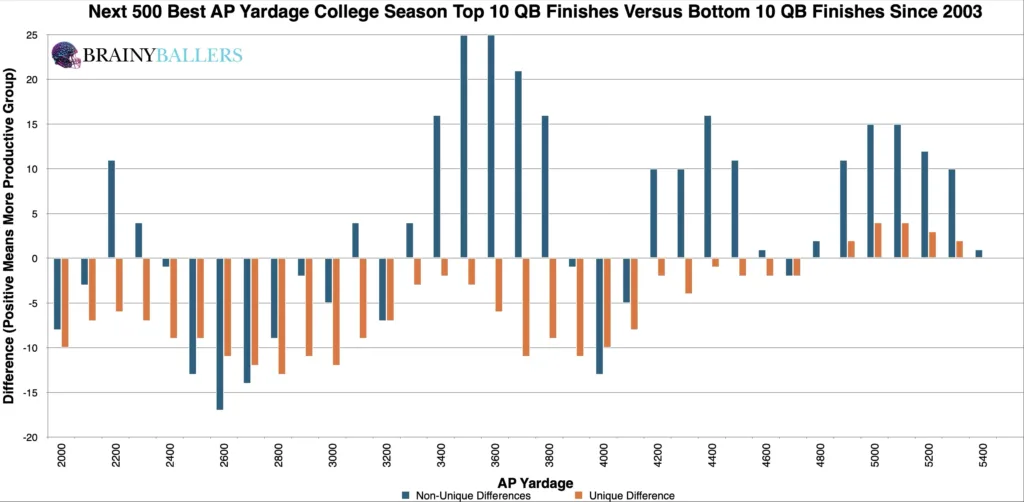
For the main pursuit of finding a threshold, or range, where college yards predict NFL success, we created our differences chart. With this, we can compare each yardage increment in addition with the next 500-yards beyond each specific yardage. The goal was to subtract the bottom 10 finishes from the top 10 across these yardages. The chart’s desired outcome is a negative number for unique differences (Orange) and a positive number for non-unique differences (Blue). This would indicate the top level consistency we are hoping for. From this analysis, it appears that 3,300 yards and above tended to have greater success, providing us a starting point to look deeper into, which we will next.
With our spreadsheet, we made quick range adjustments to ensure the highest producing range was identified. After testing various ranges and thresholds near the discovered range from our differences chart, we found that adjusting the threshold to 3,700 yards yielded the optimal range. This range produced a 17.7% higher appearance rate within the top 5 compared to the bottom 5. Therefore, this will be the subject of this research going forward.
Breaking down the top 30 fantasy finishers annually since 2003 into specific categories (top 10, 20, 30), we identified 2,300 yards as a critical threshold in developing our StarPredictor Score (SPS) model.
This is for our StarPredictor Score (SPS) model, which will attempt to predict quarterback successes and potential busts. Essentially, Quarterbacks must have at least one 2,300 AP Yards season to not be considered a surefire future bust by our model. We are hoping to have this model fully functional by the beginning of the 2026 NFL season. You can subscribe to our mailing list to get updates on this model when it begins coming out here:
Next, we looked into standard statistical methods. Specifically, we examined the correlation between top college yardage and NFL fantasy production. Those results came back as follows:
These values showcase a strong correlation between college yardage and fantasy performances. Given our focus on world-class athletes, a Pearson value over 0.1 or under -0.1 is significant for indicating predictive power. For reference to something that everyone acknowledges matters in prospect scouting, and to show the accompanying Pearson value, RB draft capital prevailed a -0.234 Pearson value.
We also applied our optimal range to identify timely trends to understand whether this is an increasing or dying trend. As seen below, our findings showed a decline in this range’s importance over the last two decades.
| 2004-2013 | |||
| Top 5 | 6 through 24 | Bottom 5 | |
| All count | 48 | 170 | 43 |
| All 3,700 and above | 25 | 52 | 10 |
| % (Optimal Range/all) | 52.1% | 30.6% | 23.3% |
| 2014-2023 | |||
| Top 5 | 6 through 24 | Bottom 5 | |
| All count | 49 | 185 | 43 |
| All 3,700 and above | 38 | 119 | 31 |
| % (Optimal Range/all) | 77.6% | 64.3% | 72.1% |
Finally, we evaluated how our projected 2025 and previous 2024 rookie quarterback NFL classes fit into our optimal range. Broken down below, we looked at all quarterbacks who fell within our optimal range and those who failed to have one season that reached our optimal range.
2024 and 2025 NFL Draft classes in our optimal range (3,700 AP Yards and above):
| Drake Maye | 5,010 |
| Jayden Daniels | 4,996 |
| Caleb Williams | 4,919 |
| Michael Penix Jr. | 4,911 |
| Bo Nix | 4,742 |
| Cam Ward | 4,181 |
| Carson Beck | 4,057 |
| Dillon Gabriel | 4,033 |
| Shadeur Sanders | 3,926 |
| Garrett Nussmeier | 3,739 |
2024 and 2025 NFL Draft classes outside our optimal range (3,650 AP Yards and below):
| Jordan Travis | 3,631 |
| Quinn Ewers | 3,554 |
| Kurtis Rourke | 3,502 |
| Devin Leary | 3,433 |
| Jalen Milroe | 3,365 |
| Drew Allar | 3,310 |
| Spencer Rattler | 3,209 |
| J.J. McCarthy | 3,193 |
| Michael Pratt | 3,138 |
| Joe Milton | 3,112 |
Our analysis found that when a quarterback has at least one season of 3,700 AP yards, they are more poised for NFL success. Top college season AP Yardage is a reliable indicator of their potential success in the NFL.
What metric matters the most when scouting a rookie Running Back? What threshold should Running Backs achieve within that metric to be considered an elite prospect? How much should you value that stat above all other stats? Couldn't answer those questions? Rest easy, we have it handled for you. That's what this chart answers. Sort by importance and/or filter by position. Unlock by signing up with the links provided. $9.99/Year or $24.99 Lifetime access. Cancel anytime.
Our series has always sought to push the boundaries of sports analytics. This latest installment reaffirms our commitment to uncovering the hidden dynamics that define the game. Every Saturday, we’ll dive into intriguing questions, bust myths, and settle debates with thorough analysis. We welcome your input. Therefore, please leave comments or reach out with topics you’re eager to see dissected. All of our research can be found on our Analytics Page. Up next on our agenda for Part 54 of “Does It Matter?” is an examination of when to sell Quarterbacks before they hit a career decline. Mark your calendars; every Saturday we shed light on the topics that matter to you. All it takes is a quick question being asked and we will go to work for you!
Support these analytics and unlock our Ultimate Athlete Blueprints, where all of our research comes together in one table for all positions. 7 day free trial. Cancel anytime.

BrainyBallers Buy-Hold-Sell Chart (All Players)
Make Money on BrainyBallers’ (Or anyone’s) content if it turns out to be incorrect!
Get Your Products 100% Refunded By Predicting The Next SuperBowl Winner!
Jaxson Dart’s journey into the spotlight of the Big Apple began in the town of Kaysville, Utah. Born here, his early years
In the 56th installment of our “Does It Matter?” series, we dive into college PFF Passer ratings to see whether they can
Part 54 of our “Does It Matter?” series focused on identifying when a quarterback is likely to decline in their career, crucial
