
Can College Yards After Catch Help Predict NFL Success For Wide Receivers?
For our 61 part “Does It Matter?” series, we looked into whether a Wide Receiver’s College Yards After Catch per Reception (YAC/Rec)


Understanding whether a Quarterback’s College Passer Rating can predict their NFL success is the question we looked to answer for part 55 of our “Does It Matter?” series. Within this analysis, you will find the optimal range we found which you can apply to your prospect scouting. Here are all of our findings:
Our analysis focused on the top 30 fantasy football finishers each season since 2003. We excluded rookie seasons to avoid skewing data with the typical transitional difficulties rookie Quarterbacks encounter. The term “bottom 10”, which you will see throughout this article, refers to the fantasy players who finished between 21st-30th. For our data, we looked at every Quarterbacks’ career passer rating, not just their top or senior season.
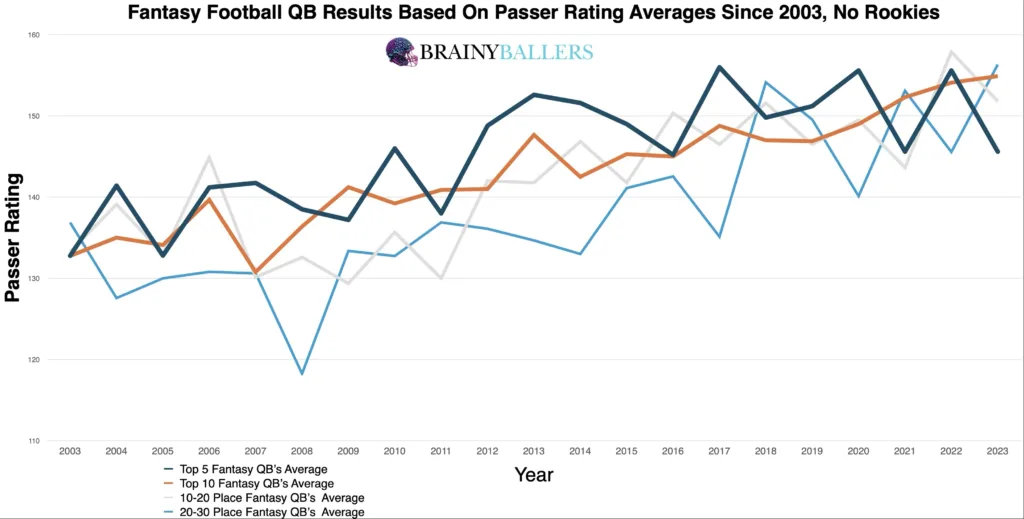
To begin, we crafted an averages chart which categorizes Passer Rating scores of fantasy leaderboards into four different groups: top 5, top 10, 11-20th, and 21st-30th. Our findings demonstrated that quarterbacks with superior college Passer Ratings consistently translated to better NFL fantasy performances. As you can see, in 17 out of 21 seasons analyzed (80.9%), the top 5 fantasy finishers had the same or higher college Passer Ratings than those in the 21st-30th range. This was the beginning of highlighting the potential of Passer Rating as a predictor of NFL success.
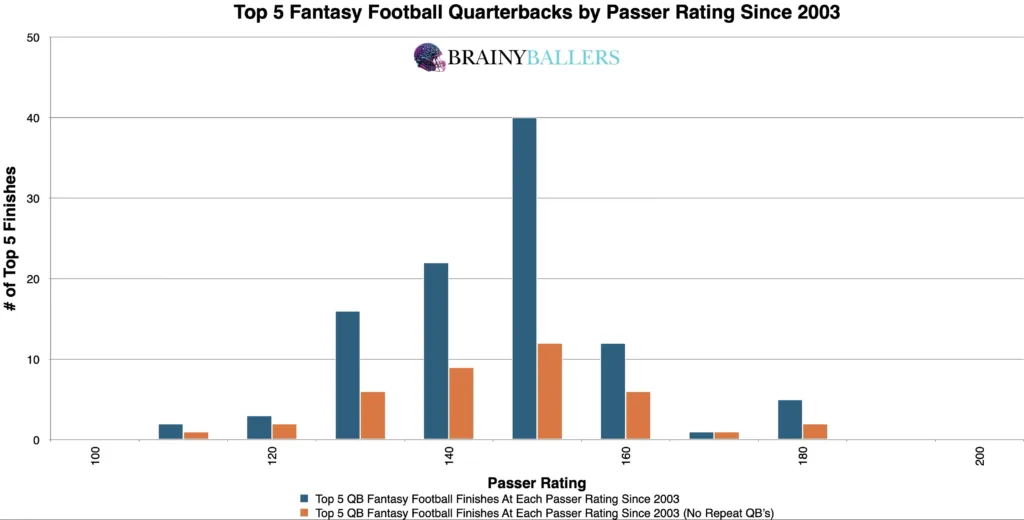
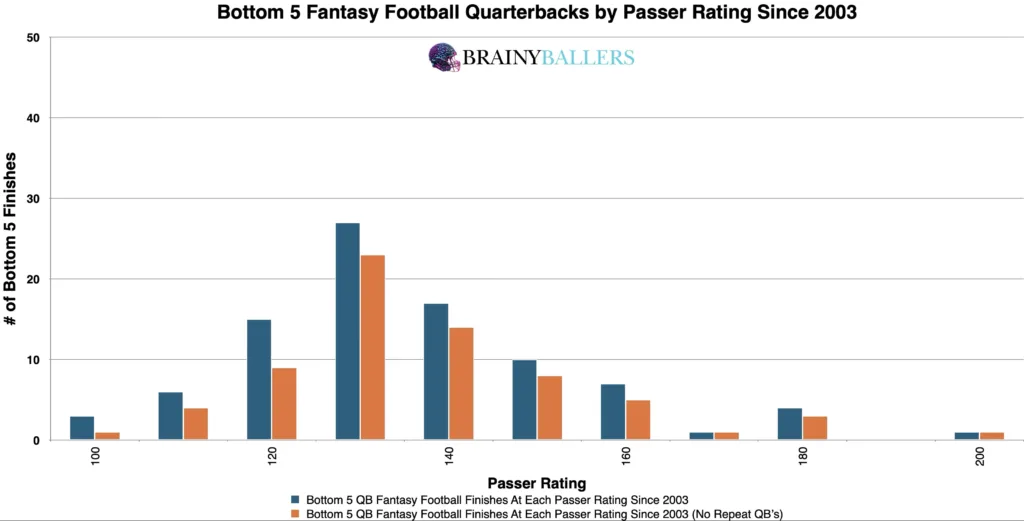
By breaking down the top and bottom 5 fantasy finishers since 2003 into 10-point Passer Rating increments, we could further spot any trends taking shape. The distribution of quarterbacks in both of these charts strengthened the hypothesis that higher College Passer Ratings link directly to higher fantasy successes. Those charts can be seen below, with the top 5 coming first:
To identify a threshold which is the most conducive to elite NFL performances, we constructed a differences chart. This chart compares the Passer Rating of each player, plus the next 10.0 Passer Rating, by subtracting the bottom 5 results from the top 5. The chart’s desired outcome is a negative number for unique differences (Orange) and a positive number for non-unique differences (Blue). This would indicate the top level consistency we are hoping for. Our analysis revealed a key discovery: quarterbacks with a college Passer Rating of 140 and above showed the highest increase in performances. We will next attempt to verify this as the top producing range.
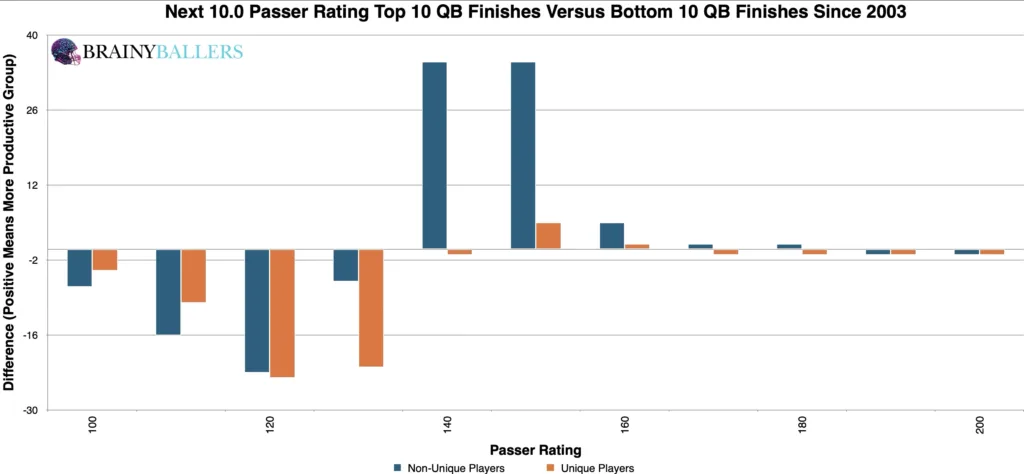
We inputted these findings into our spreadsheet and made range adjustments to validate this as the highest producing college Passer Rating range. Through testing of numbers in close proximity to the initial range, we confirmed that maintaining the threshold at 140 Passer Rating and above prevailed the highest producing range. This range yielded a 38.1% higher appearance rate in the top 5 performers than in the bottom 5. Therefore, this will be the optimal range for college Passer Rating, and will be the subject of this study going forward.
Due to these findings, college passer rating could play a factor in our Star-Predictor Score (SPS) model. Since 113 rating is the lowest seen since 2003 in the top 10, this will be the critical value for the SPS. The Star-Predictor Score (SPS) is a scouting tool designed to maximize investment potential and reduce risks when drafting rookies in Fantasy Football. It is proven to have a higher accuracy than draft capital alone to predict fantasy success. The SPS includes 13 to 17 metrics, with the exact number varying by the player’s position. All these metrics are pre-NFL, and some are invented by us, providing a complete analysis of a player’s analytical profiles. The SPS gained widespread notoriety for its high accuracy, having made it on Barstool and The Pat McAfee Show. The SPS can be found here.
By employing standard statistical methods, we found a Pearson value:
This value shows significant correlation between college Passer Ratings and fantasy production. We are hoping for a minimum of 0.1, or an inverse correlation maximum of -0.1 when we study world-class athletes as we are. For reference to something that everyone acknowledges matters in prospect scouting, and to show the accompanying Pearson value, QB draft capital prevailed a -0.219 Pearson value.
Our next step was to compare this optimal range’s significance across the last two decades to assess how significant it is becoming. This decadal differences chart indicates a sustained significance in the identified optimal range. In other words, this is not a dying or growing trend.
| 2004-2013 | |||
| Top 5 | 6 through 24 | Bottom 5 | |
| All count | 50 | 200 | 50 |
| All 140 and above | 33 | 88 | 12 |
| % (Optimal Range/all) | 66.0% | 44.0% | 24.0% |
| 2014-2023 | |||
| Top 5 | 6 through 24 | Bottom 5 | |
| All count | 50 | 200 | 50 |
| All 140 and above | 45 | 141 | 26 |
| % (Optimal Range/all) | 90.0% | 70.5% | 52.0% |
What 3 metrics matter the most when scouting a rookie Quarterback? What threshold should Quarterbacks achieve within those metrics to be considered an elite prospect? How much should you value those stats above all other stats? Couldn't answer those questions? Rest easy, we have it handled for you. That's what this chart answers. Sort by importance and/or filter by position. Unlock by signing up with the links provided. $9.99/Year or $24.99 Lifetime access. Cancel anytime.
In conclusion, our findings were a threshold of 140 college Passer Rating for top performers, which is what you should be looking for in athletes. Not just 140 and above, but you should also be hoping for as high of a career passer rating as you can get since there was a positive statistical correlation found between passer rating and fantasy points. To sum it up: Quarterbacks with higher college career Passer Ratings have a greater likelihood of professional success.
Our series has always sought to push the boundaries of sports analytics. This latest installment reaffirms our commitment to uncovering the hidden dynamics that define the game. Every Saturday, we’ll dive into intriguing questions, bust myths, and settle debates with thorough analysis. We welcome your input. Therefore, please leave comments or reach out with topics you’re eager to see dissected. All of our research can be found on our Analytics Page. Up next on our agenda for Part 56 of “Does It Matter?” is an examination of Quarterback Career Declines. When should you sell? Mark your calendars; every Saturday we shed light on the topics that matter to you. All it takes is a quick question being asked and we will go to work for you!


BrainyBallers Buy-Hold-Sell Chart (All Players)
Get Your Products 100% Refunded By Predicting The Next SuperBowl Winner!
For our 61 part “Does It Matter?” series, we looked into whether a Wide Receiver’s College Yards After Catch per Reception (YAC/Rec)

In part 60 of our “Does It Matter?” series, we dove into the question of whether a college Wide Receiver’s career Average

The “Does It Matter?” series, part 59 looked to uncover the role of a quarterback’s rookie touchdown per game (TD/G) in predicting
