
Can Draft Capital Help Predict Tight End Success?
In our 63-part analytical series, “Does It Matter?”, we next wanted to look into the intriguing question of whether a Tight End’s


For our 49th installment in the “Does It Matter?” series, we looked into the significance of a quarterback’s college career touchdown-to-interception (TD/INT) ratio to see whether it can predict their success in the NFL. Here are all of our findings:
To gauge the relevance of college TD/INT ratios, we analyzed data from the top 30 fantasy football finishers each year since 2003. In this study, you will see the term “bottom 10”, which refers to quarterbacks finishing between 21st and 30th place in fantasy rankings each season. We only used the full college career TD/INT Ratios, not the top or senior season. For our data, we excluded rookie Quarterback seasons. This was for not including the learning curve that comes with being an NFL Quarterback typically. Any numbers seen in here are rounded to the nearest tenths.
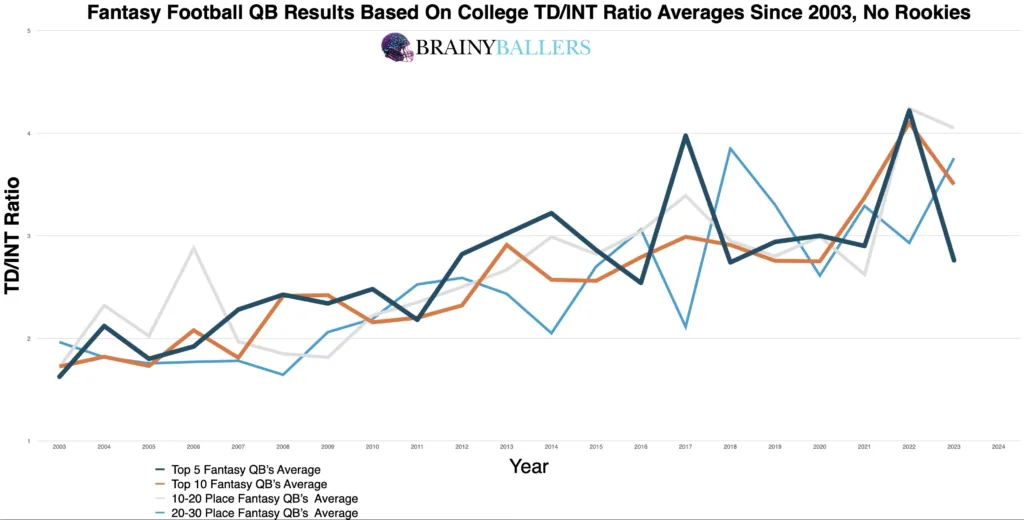
The first part of our study was to look at our averages chart, categorizing fantasy finishers into 4 groups: top 5, top 10, 11-20th, and bottom 10. This data indicated that quarterbacks with higher college TD/INT ratios typically achieved better fantasy scores. As you can see, 14 out of 21 seasons (66.7%), the top 5 finishers had better college TD/INT ratios compared to those who finished 21st-30th. This suggested a possible correlation between a quarterback’s college TD/INT Ratio and their success in the NFL.
To begin diving deeper, we segmented the top 10 finishers into increments of 0.1 TD/INT ratios. This analysis further supported the initial findings: higher college TD/INT ratios typically corresponded with higher fantasy rankings. You can see that from the comparison of chart weights below, with the top 10 coming first:
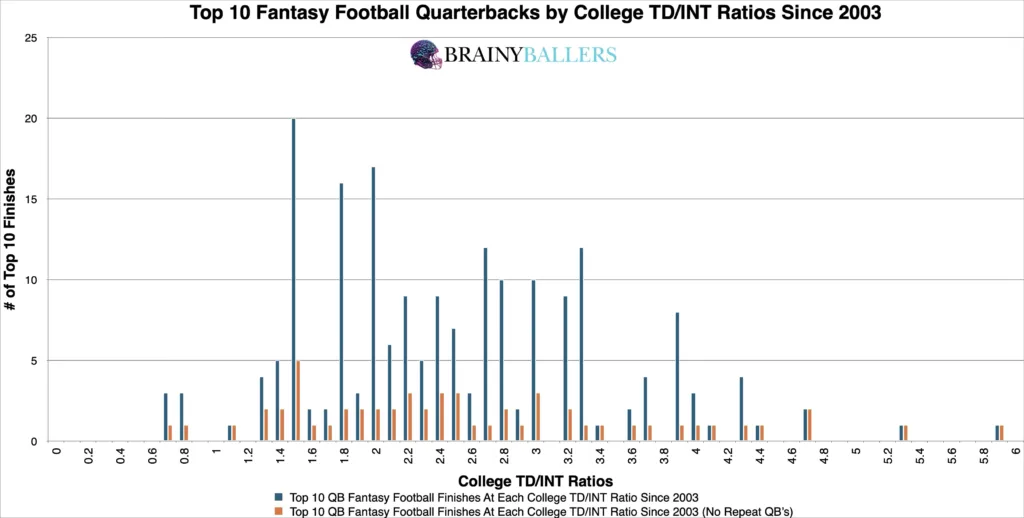
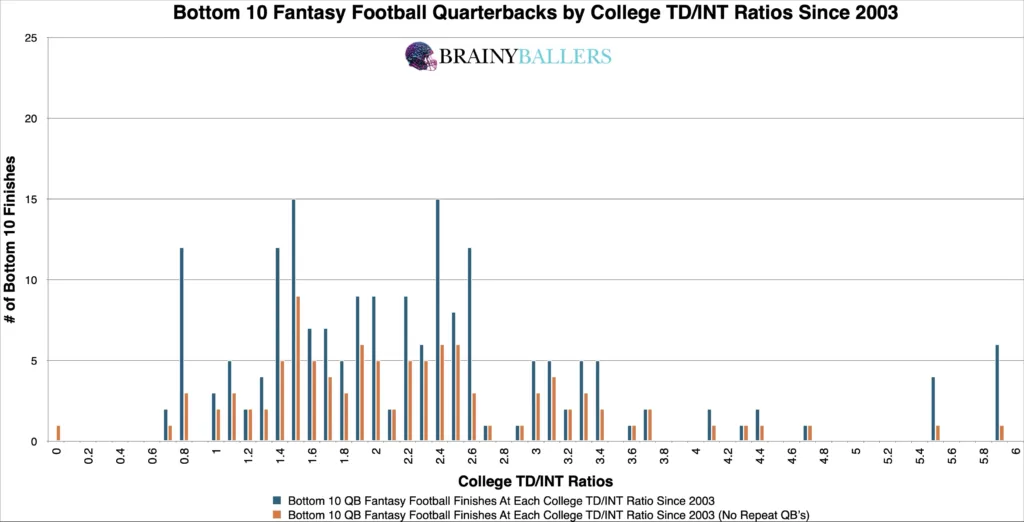
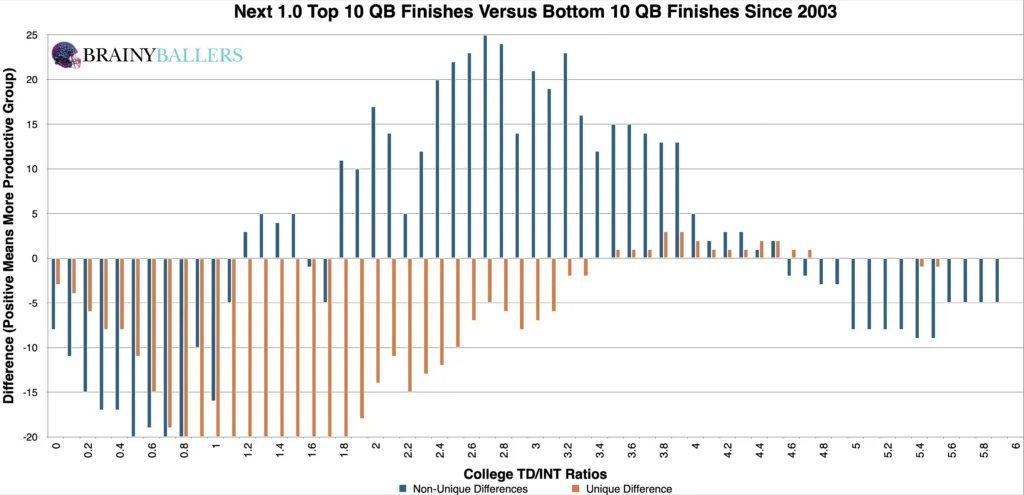
Our primary goal was to find a threshold where the greatest increase in performances typically occur. Also, we wanted to couple this with the fewest unique players appearing which would be an indicator of top-level consistency. To achieve this, we created a differences chart comparing college career TD/INT Ratios. The chart included each ratio, plus the next 1.0, comparing the top 10 results against the bottom 10. The chart’s desired outcome is a negative number for unique differences (Orange) and a positive number for non-unique differences (Blue). This would indicate the top level consistency we are hoping for. Our analysis suggested that TD/INT ratios of 1.8 and above are indicative of elite performance levels. We will next attempt to verify this as the top producing range.
We next analyzed and adjusted the 1.8 and above threshold within our spreadsheet to ensure that we found the actual highest producing range. After testing various numbers close to our findings, we found that the threshold of 2.7 and above resulted in a 33.3% higher appearance rate in the top 5 compared to the bottom 5 since 2003. Therefore, this threshold will be the optimal range for college TD/INT ratios and will be the subject of this research going forward.
Due to these findings, TD/INT Ratios could play a factor in our Star-Predictor Score (SPS) model. Since 0.7 TD/INT Ratio is the lowest seen since 2003 in the top 10, this will be the critical value for the SPS. The Star-Predictor Score (SPS) is a scouting tool designed to maximize investment potential and reduce risks when drafting rookies in Fantasy Football. It is proven to have a higher accuracy than draft capital alone to predict fantasy success. The SPS includes 13 to 17 metrics, with the exact number varying by the player’s position. All these metrics are pre-NFL, and some are invented by us, providing a complete analysis of a player’s analytical profiles. The SPS gained widespread notoriety for its high accuracy, having made it on Barstool and The Pat McAfee Show. The SPS can be found here.
Using standard statistical methods, we calculated the Pearson correlation value for our data:
This showed a strong correlation between college TD/INT ratios and fantasy production. We are hoping for a minimum of 0.1, or an inverse correlation maximum of -0.1 when we study world-class athletes as we are. For reference to something that everyone acknowledges matters in prospect scouting, and to show the accompanying Pearson value, QB draft capital prevailed a -0.219 Pearson value.
To identify whether this is an emerging or dying trend, we applied our optimal range to our data across the last two decades. We focused on quarterbacks finishing in the top 10, 11-20th places, and the bottom 10. Although our optimal range shows a declining trend, its relevance remained strong.
| 2004-2013 | |||
| Top 5 | 6 through 24 | Bottom 5 | |
| All count | 49 | 179 | 45 |
| All 2.7 and above | 20 | 34 | 4 |
| % (Optimal Range/all) | 40.8% | 19.0% | 8.9% |
| 2014-2023 | |||
| Top 5 | 6 through 24 | Bottom 5 | |
| All count | 49 | 192 | 47 |
| All 2.7 and above | 31 | 96 | 13 |
| % (Optimal Range/all) | 63.3% | 50.0% | 27.7% |
What 3 metrics matter the most when scouting a rookie Quarterback? What threshold should Quarterbacks achieve within those metrics to be considered an elite prospect? How much should you value those stats above all other stats? Couldn't answer those questions? Rest easy, we have it handled for you. That's what this chart answers. Sort by importance and/or filter by position. Unlock by signing up with the links provided. $9.99/Year or $24.99 Lifetime access. Cancel anytime.
Our research of college career TD/INT ratios has verified a predictive power towards NFL performances. From this study, it is evident that quarterbacks showcasing higher efficiency in college typically translate that success to the professional level. Look for Quarterbacks with a 2.7 and above College career TD/INT Ratio.
Our series has always sought to push the boundaries of sports analytics. This latest installment reaffirms our commitment to uncovering the hidden dynamics that define the game. Every Saturday, we’ll dive into intriguing questions, bust myths, and settle debates with thorough analysis. We welcome your input. Therefore, please leave comments or reach out with topics you’re eager to see dissected. All of our research can be found on our Analytics Page. Up next on our agenda for Part 50 of “Does It Matter?” is an examination of Quarterback Draft Capital: Does it matter? If so, what’s the Draft Capital threshold necessary for NFL success? Mark your calendars; every Saturday we shed light on the topics that matter to you. All it takes is a quick question being asked and we will go to work for you!


BrainyBallers Buy-Hold-Sell Chart (All Players)
Get Your Products 100% Refunded By Predicting The Next SuperBowl Winner!
In our 63-part analytical series, “Does It Matter?”, we next wanted to look into the intriguing question of whether a Tight End’s

For our 61 part “Does It Matter?” series, we looked into whether a Wide Receiver’s College Yards After Catch per Reception (YAC/Rec)

In part 60 of our “Does It Matter?” series, we dove into the question of whether a college Wide Receiver’s career Average
