
Can College Yards After Catch Help Predict NFL Success For Wide Receivers?
For our 61 part “Does It Matter?” series, we looked into whether a Wide Receiver’s College Yards After Catch per Reception (YAC/Rec)


For part 50 of our “Does It Matter?” series, we looked into whether a Quarterback’s NFL success can be predicted by their draft capital. Our main goal was to find whether the draft capital spent on a Quarterback can predict their NFL success, and subsequently where you should hope for your favorite athlete to be drafted at. Here are all of our findings:
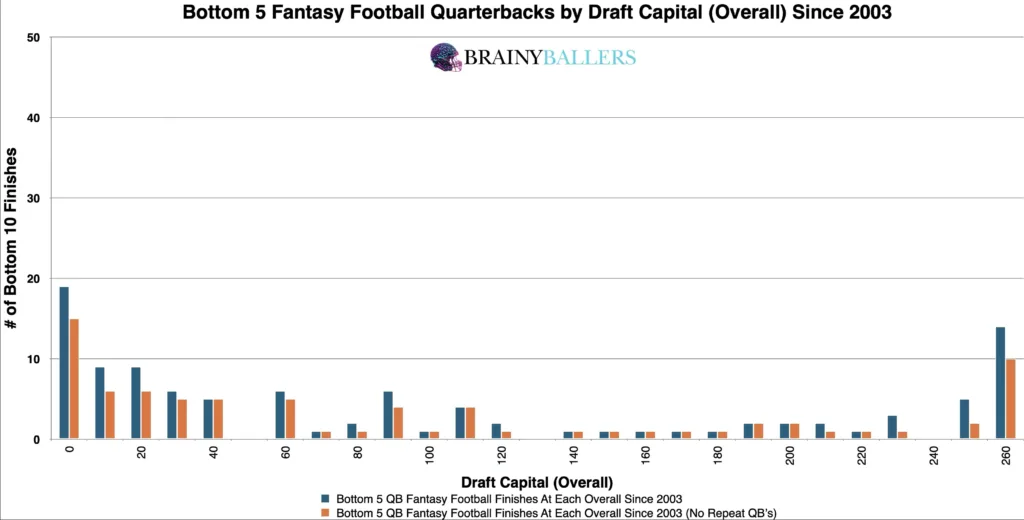
To structure our study, we examined the top 30 fantasy football finishers since 2003. The “bottom 10”, which you will see throughout this study, refers to quarterbacks finishing 21st-30th each season. All numbers are rounded to the nearest 10th overall draft capital.
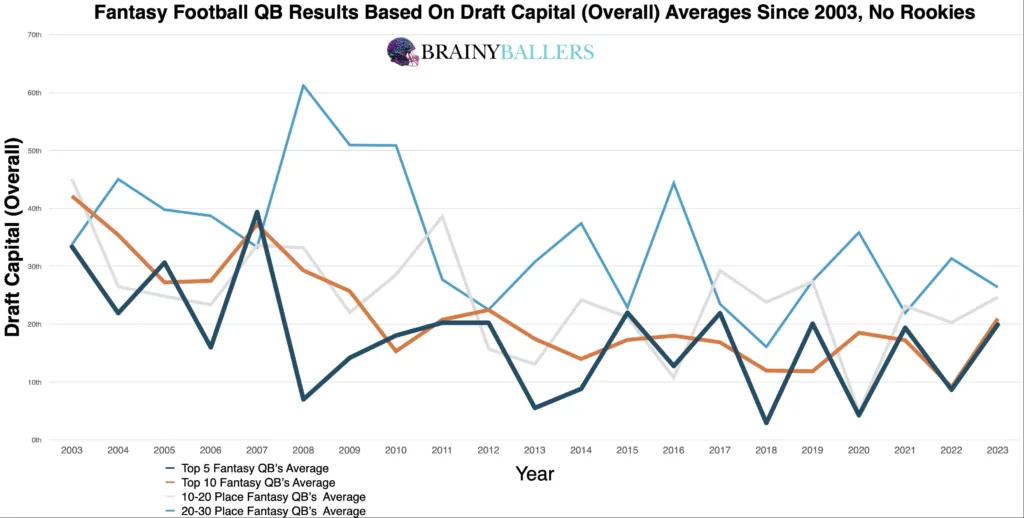
To begin, we created a chart to visualize averages across 4 different leaderboard ranges: top 5, 10, 11-20, and 21-30th place finishers since 2003. This revealed an obvious trend: quarterbacks with higher valued draft capital consistently achieved better fantasy scores. As you can see, 95.2% of the time (20 out of 21 seasons), the top 5 finishers were drafted equally or earlier compared to those finishing in the bottom 10.
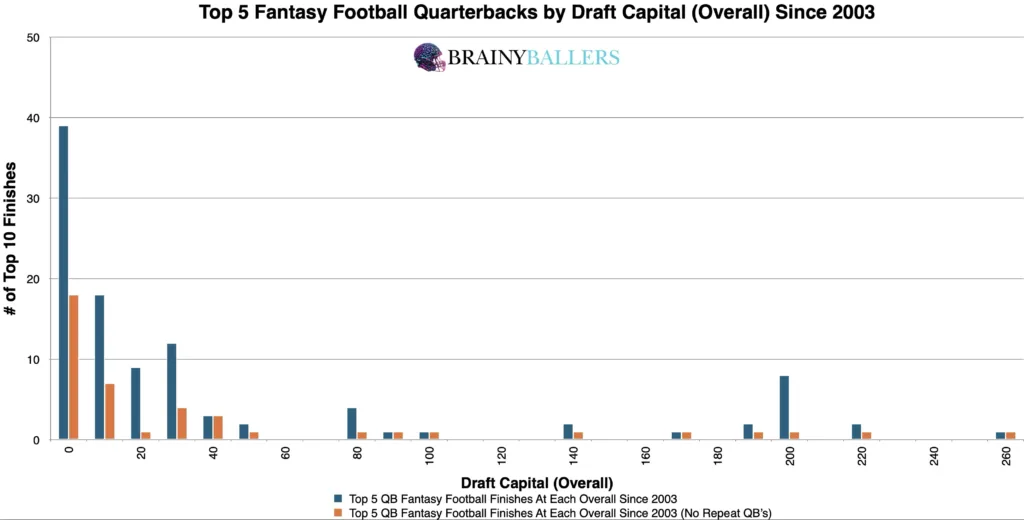
To further visualize this pattern, we charted the top 10 finishers from 2003, breaking down the data into 10 overall pick increments. Here, too, higher valued draft capitals showed a strong correlation with higher fantasy performances. This is evident by comparing the weight of both charts:
Our next goal was to pinpoint an applicable threshold where the highest increase of performances in quarterbacks occur at the top of leaderboards. To achieve this, we created a differences chart to compare each overall pick, plus the next 30 overall picks by subtracting the bottom 10 results from the top 10 across that range. The chart’s desired outcome is a negative number for unique differences (Orange) and a positive number for non-unique differences (Blue). This would indicate the top level consistency we are hoping for. This chart revealed the following: quarterbacks drafted 50th overall and earlier consistently demonstrated superior performances. This assisted in defining a potential optimal range for top-level performances, which we will verify next.
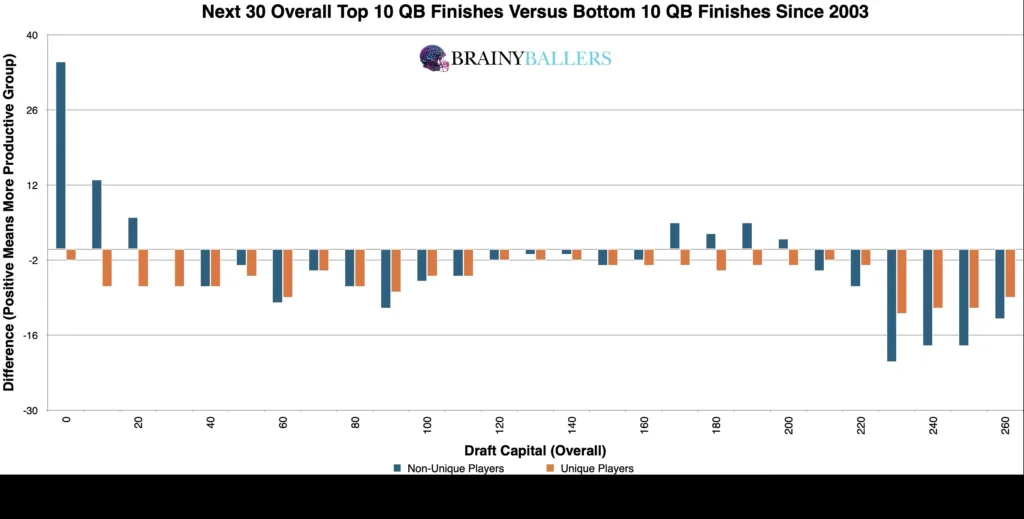
When we adjusted the numbers within our spreadsheets and tested various other thresholds and ranges to verify this as the top producing range or to find another one, we determined that the 1st-50th overall range yields a 33.3% higher rate of top 5 appearances compared to bottom 5 finishes since 2003. This range is therefore the optimal range and will be the basis of this study going forward.
Due to these findings, draft capital could play a factor in our Star-Predictor Score (SPS) model. Since UDFA is the lowest seen since 2003 in the top 10, there will not be a critical value for the SPS in regards to draft capital. The Star-Predictor Score (SPS) is a scouting tool designed to maximize investment potential and reduce risks when drafting rookies in Fantasy Football. It is proven to have a higher accuracy than draft capital alone to predict fantasy success. The SPS includes 13 to 17 metrics, with the exact number varying by the player’s position. All these metrics are pre-NFL, and some are invented by us, providing a complete analysis of a player’s analytical profiles. The SPS gained widespread notoriety for its high accuracy, having made it on Barstool and The Pat McAfee Show. The SPS can be found here.
In applying standard statistical methods to evaluate this as a possible predictor of NFL success, we focused on the Pearson correlation value:
This value showcases a correlation between a quarterback’s draft capital and their fantasy production. Given our focus on world-class athletes, a Pearson value over 0.1 or under -0.1 is significant for indicating predictive power. For reference to something that everyone acknowledges matters in prospect scouting, and to show the accompanying Pearson value, RB draft capital prevailed a -0.234 Pearson value.
To detect trends over time, we compared our data in the last two decades to assess the significance of our identified draft capital threshold for those finishing in the top 10, 11-20th, and bottom 10 positions. Our decadal differences chart revealed that while the optimal range remains a declining trend, it still had significance in the most recent decade.
| 2004-2013 | |||
| Top 5 | 6 through 24 | Bottom 5 | |
| All count | 50 | 200 | 50 |
| All 55 OVR and below | 40 | 121 | 20 |
| % (Optimal Range/all) | 80.0% | 60.5% | 40.0% |
| 2014-2023 | |||
| Top 5 | 6 through 24 | Bottom 5 | |
| All count | 50 | 200 | 50 |
| All 55 OVR and below | 40 | 145 | 26 |
| % (Optimal Range/all) | 80.0% | 72.5% | 52.0% |
What 3 metrics matter the most when scouting a rookie Quarterback? What threshold should Quarterbacks achieve within those metrics to be considered an elite prospect? How much should you value those stats above all other stats? Couldn't answer those questions? Rest easy, we have it handled for you. That's what this chart answers. Sort by importance and/or filter by position. Unlock by signing up with the links provided. $9.99/Year or $24.99 Lifetime access. Cancel anytime.
In summary, our dive into draft capital and quarterback success has revealed that higher valued draft capital translates into greater fantasy football success. We defined the 50th overall and earlier threshold as the optimal range, which is essentially 3/4 through the 2nd round.
Our series has always sought to push the boundaries of sports analytics. This latest installment reaffirms our commitment to uncovering the hidden dynamics that define the game. Every Saturday, we’ll dive into intriguing questions, bust myths, and settle debates with thorough analysis. We welcome your input. Therefore, please leave comments or reach out with topics you’re eager to see dissected. All of our research can be found on our Analytics Page. Up next on our agenda for Part 51 of “Does It Matter?” is an examination of Quarterback Best College Yardage Season: Does it matter? If so, what’s the yardage threshold necessary for NFL success? Mark your calendars; every Saturday we shed light on the topics that matter to you. All it takes is a quick question being asked and we will go to work for you!


BrainyBallers Buy-Hold-Sell Chart (All Players)
Get Your Products 100% Refunded By Predicting The Next SuperBowl Winner!
For our 61 part “Does It Matter?” series, we looked into whether a Wide Receiver’s College Yards After Catch per Reception (YAC/Rec)

In part 60 of our “Does It Matter?” series, we dove into the question of whether a college Wide Receiver’s career Average

The “Does It Matter?” series, part 59 looked to uncover the role of a quarterback’s rookie touchdown per game (TD/G) in predicting
