
Can Draft Capital Help Predict Tight End Success?
In our 63-part analytical series, “Does It Matter?”, we next wanted to look into the intriguing question of whether a Tight End’s


In Part 30 of the “Does It Matter?” series, we dove into the question of whether a Defensive Backs’ 40-yard dash time can be a predictor for their NFL success. Here are all our findings:
To conduct our analysis, we explored data from the top 50 fantasy football scorers from 2003 onwards, focusing on PPR (Points Per Reception) scoring. Our primary goal was to find whether there is correlation between 40-yard dash times and Fantasy Football success, defined by fantasy football rankings. Within this article, the “bottom 10” term refers to players finishing in 41st-50th place each season.
Why the top 50 players only: we wanted to maintain focus on impactful performances while avoiding fringe roster players who could simply skew results. This top 50 range is a “happy medium” which allows us to compare the best and worst, while allowing us to really compare the best to the worst. Essentially, comparing the top 10 to a number which includes the 11th place finisher does not satisfy our personal itch for finding a trend.
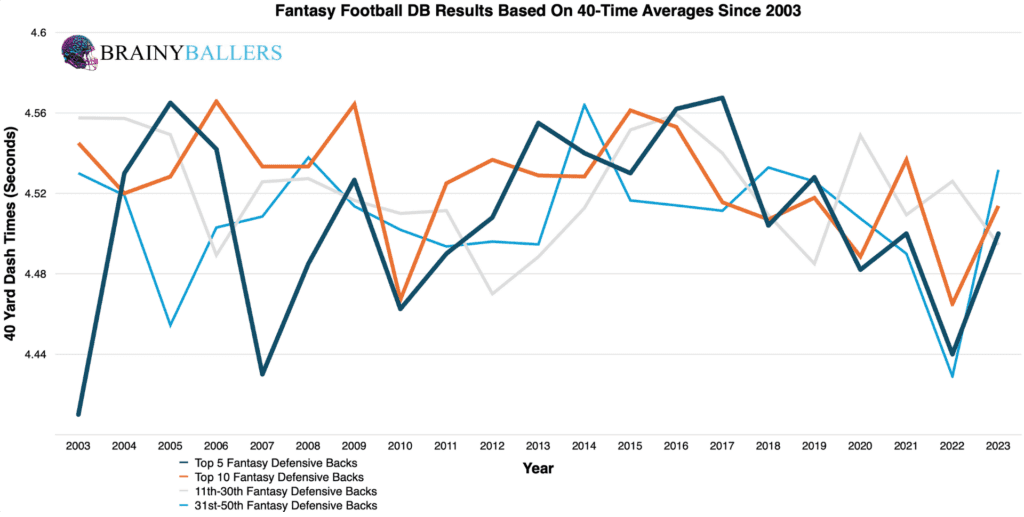
The first step of this research involved creating an averages chart. This highlights the trends among the top 5, 10, 11-30th, and 31-50th place finishers since 2003. Upon reviewing this chart, no trends emerged. Surprisingly, in 12 out of 21 seasons (57.1%), the 40-yard dash times for Top 10 finishers were equal to, or even higher, than those for the 31st-50th finishers. This chart usually shows us how the regression testing will end up, therefore, these results led us to begin doubting 40-times as a predictor for DB success. The averages chart can be seen below:
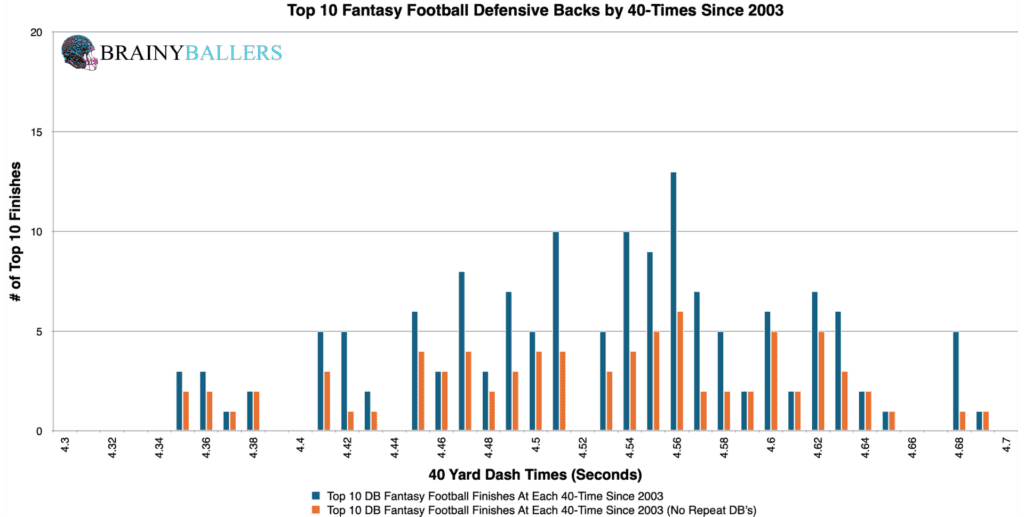
To find deeper insights, we examined the top and bottom 10 fantasy finishers by sorting them according to their 40-times in increments of 0.01 seconds. This segmentation was an attempt to make it more obvious where the higher performances occur at in accordance with 40-times. Contrary to expectations, this analysis showed slower 40-yard dash times occurring more frequently in the top 10 finishers. This shows that faster DB’s were not consistently outperforming their slower peers.
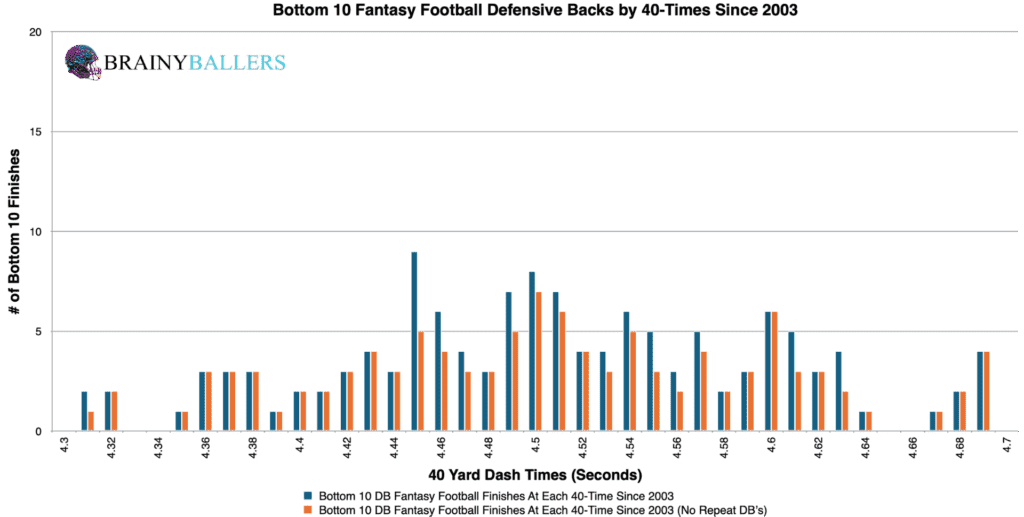
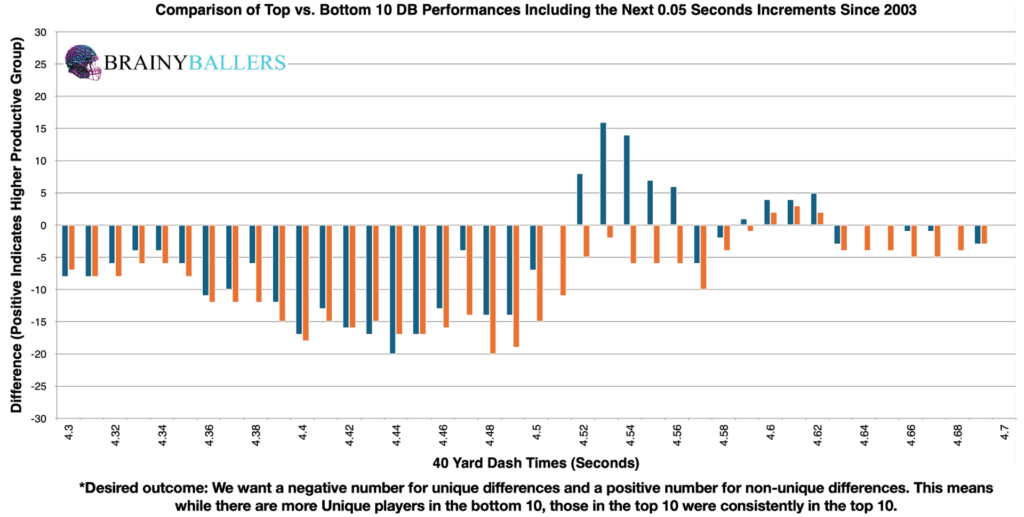
Our primary goal was to find a sweet spot in Defensive Back 40 yard dash times. To achieve this, we created a differences chart. This chart accounts for each 40-time with the next 0.05-seconds, subtracting the bottom 10 from the top 10. The chart’s desired outcome is a negative number for unique differences (Orange) and a positive number for non-unique differences (Blue). This would indicate the desired consistent top level performances we are hoping for. From this, we found that the range between 4.52 to 4.67 seconds appears to be a top-performing threshold, which we will attempt to verify next.
We now want to backtest this range against historical data from DBs finishing in the bottom 10 since 2003. Out of 136 players, 53 had 40-yard dash times within 4.52 to 4.67 seconds, accounting for 38.2%. This percentage now serves as our baseline to determine whether this range represents an average DB’s 40-time, or a top-performing DB’s 40-time.
To validate this, we looked at the 147 top 10 finishers with a 40-time from 2003 to 2023. We found that 75 of these finishers fell within this same range, accounting for 51.0%. This was a 12.8% increase compared to the baseline, suggesting this 40-time range is possibly the top performing range. Although, we want to slightly alter this to attempt to verify this as the top-producing range, or find a better producing one, which we will do next.
When we Utilized our spreadsheet for quick adjustments, we discovered that adjusting the range to 4.53 to 4.68 seconds resulted in a 17.7% higher appearance rate among top 10 finishers than in the bottom 10. Therefore, this will be the subject of this study going forward.
Due to these findings, 40-Times could play a small factor in our Star-Predictor Score (SPS) model. Since 4.75 seconds is the slowest seen since 2003 in the top 10, this will be the critical value for the SPS. The Star-Predictor Score (SPS) is a scouting tool designed to maximize investment potential and reduce risks when drafting rookies in Fantasy Football. It is proven to have a higher accuracy than draft capital alone to predict fantasy success. The SPS includes 13 to 17 metrics, with the exact number varying by the player’s position. All these metrics are pre-NFL, and some are invented by us, providing a complete analysis of a player’s analytical profiles. The SPS gained widespread notoriety for its high accuracy, having made it on Barstool and The Pat McAfee Show. The SPS can be found here.
Using standard statistical methods, we analyzed the correlation between a DB’s 40-time and their fantasy production. Here is what prevailed from that:
This value indicates no significant correlation between Defensive Backs 40-Times and fantasy production. We are hoping for a minimum of 0.1, or an inverse correlation maximum of -0.1 when we study world-class athletes as we are. For reference to something that everyone acknowledges matters in prospect scouting, and to show the accompanying Pearson value, QB draft capital prevailed a -0.219 Pearson value.
To identify this as an emerging or dying trend, we broke our optimal 40-time threshold down across decades for the top 10 finishers and those ranked 11th to 40th and bottom 10. This chart shows this 40-time range becoming even less significant in the most recent decade. That can be noticed when comparing the Bottom 10 to Top 10 differences in each decade.
| 2004-2013 | |||
| Top 10 | 11 through 40 | Bottom 10 | |
| All count | 66 | 202 | 63 |
| All Between 4.53 and 4.68 seconds | 38 | 81 | 19 |
| % (Optimal Range/all) | 57.6% | 40.1% | 30.2% |
| 2014-2023 | |||
| Top 10 | 11 through 40 | Bottom 10 | |
| All count | 79 | 210 | 69 |
| All Between 4.53 and 4.68 seconds | 41 | 86 | 28 |
| % (Optimal Range/all) | 51.9% | 41.0% | 40.6% |
What 3 metrics matter the most when scouting a rookie Quarterback? What threshold should Quarterbacks achieve within those metrics to be considered an elite prospect? How much should you value those stats above all other stats? Couldn't answer those questions? Rest easy, we have it handled for you. That's what this chart answers. Sort by importance and/or filter by position. Unlock by signing up with the links provided. $9.99/Year or $24.99 Lifetime access. Cancel anytime.
The hypothesis that 40-yard dash times could predict Defensive Backs’ success in the NFL did not find support in our study. Averages and Pearson value analyses suggested that having a faster 40-time is not a guaranteed ticket to a top tier NFL performance.
Our series has always sought to push the boundaries of sports analytics. This latest installment reaffirms our commitment to uncovering the hidden dynamics that define the game. Every Saturday, we’ll dive into intriguing questions, bust myths, and settle debates with thorough analysis. We welcome your input. Therefore, please leave comments or reach out with topics you’re eager to see dissected. All of our research can be found on our Analytics Page. Up next on our agenda for Part 31 of “Does It Matter?” is an examination of Defensive Back RAS (Relative Athletic Score): Does it matter? If so, what’s the RAS threshold necessary for NFL success? Mark your calendars; every Saturday we shed light on the topics that matter to you. All it takes is a quick question being asked and we will go to work for you!


BrainyBallers Buy-Hold-Sell Chart (All Players)
Get Your Products 100% Refunded By Predicting The Next SuperBowl Winner!
In our 63-part analytical series, “Does It Matter?”, we next wanted to look into the intriguing question of whether a Tight End’s

For our 61 part “Does It Matter?” series, we looked into whether a Wide Receiver’s College Yards After Catch per Reception (YAC/Rec)

In part 60 of our “Does It Matter?” series, we dove into the question of whether a college Wide Receiver’s career Average
