
Can Draft Capital Help Predict Tight End Success?
In our 63-part analytical series, “Does It Matter?”, we next wanted to look into the intriguing question of whether a Tight End’s


For part 28 of our “Does It Matter?” series, we looked into the question of whether a defensive back’s height can be a predictor of their success in the NFL. By utilizing our collected data, we found an optimal range which has a higher appearance rate in the top performers. Here are all of our findings:
To conduct this study, we used the top 50 fantasy football finishers each season since 2003. Our primary focus was on identifying any notable differences between players who finished in the top 10 and those in the “bottom 10,” defined as finishers ranking 41st to 50th each season.
Why the top 50? The reason we chose the top 50 is to find a happy medium. We don’t want to go further than the top 50 and start getting close to the fringe roster members whom obviously are not going to score top 10. These players could therefore just weigh the data. On the other hand, We want to compare the worst to the best still. Comparing the top 10 to the 11th place finisher, or an average number that takes into account the 11th place finisher, doesn’t satisfy our personal itch to try to find trends.
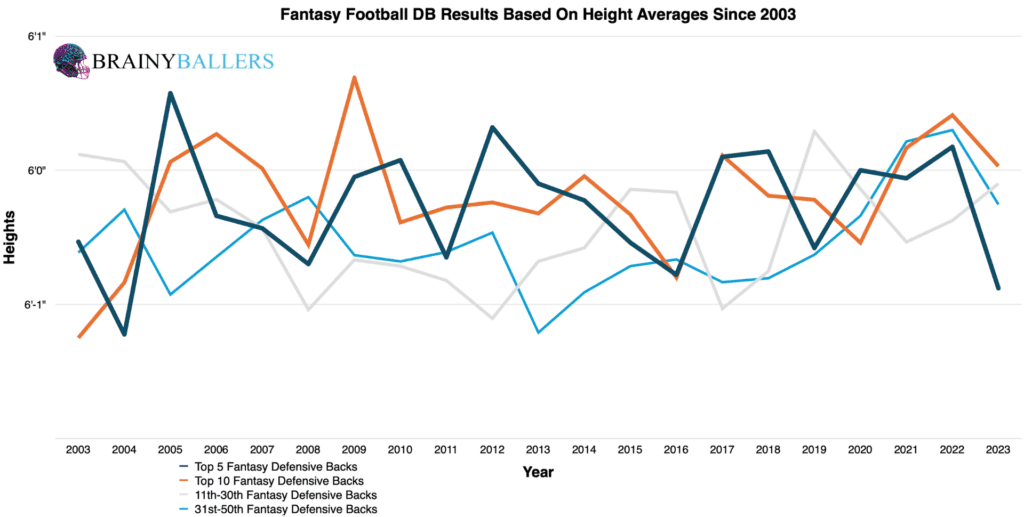
The first thing we did was create an averages chart to depict the height trends among various groups of finishers. Those finisher groups are as follows: the top 5, top 10, finishes ranked 11th-30th, and those ranked 31st-50th. This analysis revealed a solid trend: in 16 out of 21 seasons (76.2%), players who finished in the top 10 had heights that were equivalent to or taller than players in the 31st-50th group.
This suggests a potential correlation where taller defensive backs are more likely to achieve higher fantasy scores.
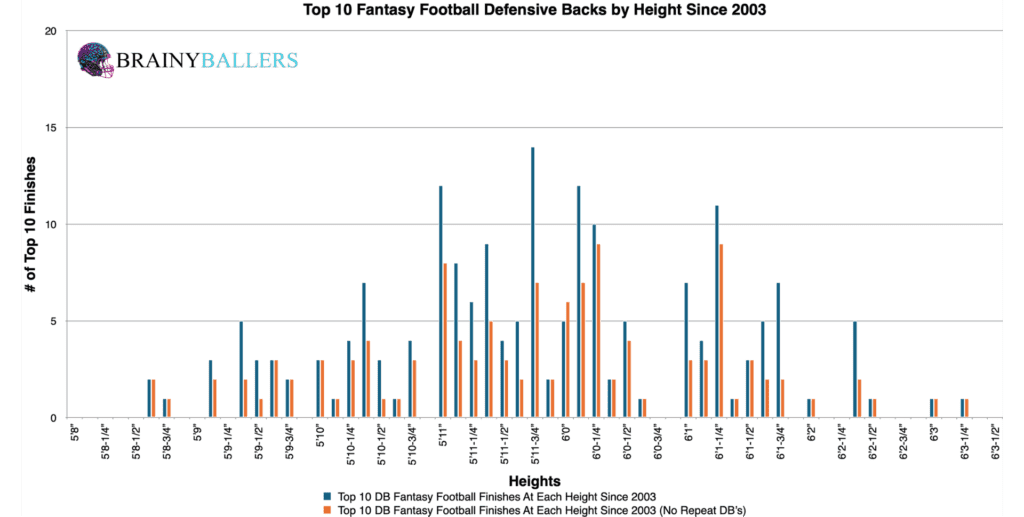
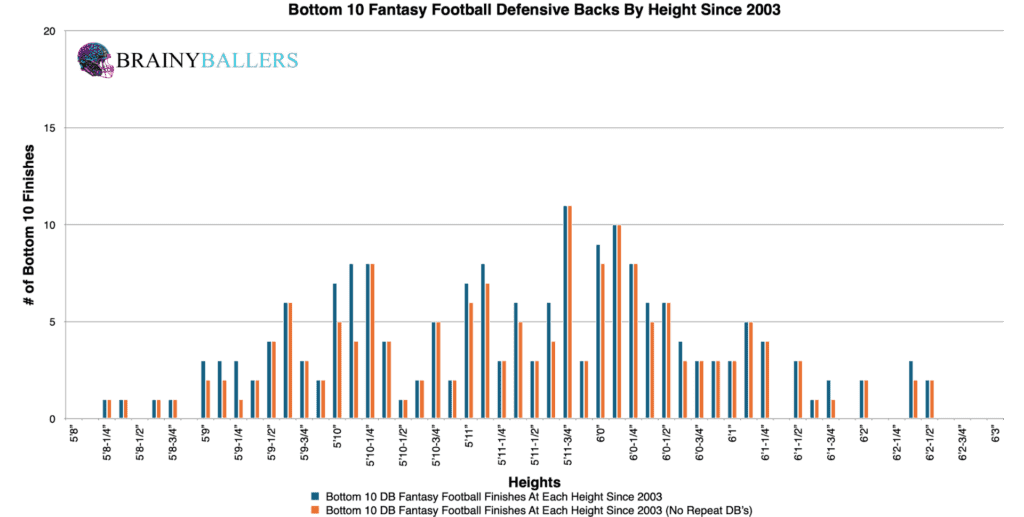
Further, we segmented the top 10 finishers since 2003 into increments of 1/8″. This attempt aimed to identify any significant height-related trends amongst top-performing defensive backs. However, this segmentation did not reveal any clear or significant correlations. As you can see below, the top 10 has a larger sample size, but the weight of the graph does not appear to change going from the top 10 to the bottom 10.
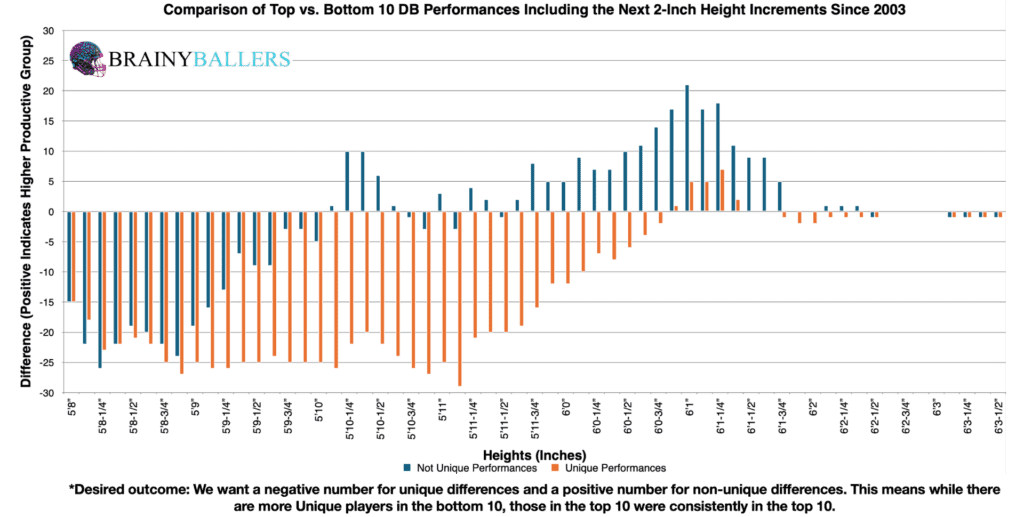
Our main goal was to determine a specific height threshold, or range, for Defensive Backs that corresponds to the highest performance increase. To achieve this, we developed a differences chart comparing each height, plus the following two inches, and subtracting the bottom 10 results from the top 10 finishers. The chart’s desired outcome is a negative number for unique differences (Orange) and a positive number for non-unique differences (Blue). This would indicate the desired consistent top level performances we are hoping for. This analysis revealed 5’10-1/8” and above as the potential performance threshold, as you can see from the chart below:
Our next step involved comparing this height threshold to all DBs who finished in the bottom 10 from 2003 onwards. Out of 190 DBs, 153 were at or above this height threshold, representing 80.5%. This figure served as a baseline for comparison to the top 10. This comparison will help us decide whether we identified the average height for all DBs, or specifically top-performing DBs. If over 80.5% of the top 10 finishers were above this threshold, it would confirm the latter of those two.
Looking into the top 10 finishers from 2003 to 2023 revealed that 164 out of 186 finishers fell within this height threshold, accounting for 88.2%. This indicates a 7.6% increase compared to the baseline. This considerable increase led us to believe that we had pinpointed the average height for specifically top-performing DBs. Although, we wanted to adjust this threshold to be sure we found the top performing one.
To verify the accuracy of this threshold, we experimented with various thresholds near the differences chart’s findings. Upon testing, setting the height threshold to 5’10-3/8” and above yielded a 14.1% higher rate of top 10 appearances than bottom 10 finishes. This refined height threshold of 5’10-3/8” and above will be the focus of this study going forward.
Due to these findings, height could play a factor in our Star-Predictor Score (SPS) model. Since 5’8-5/8” is the lowest seen since 2003 in the top 10, this will be the critical value for the SPS. The Star-Predictor Score (SPS) is a scouting tool designed to maximize investment potential and reduce risks when drafting rookies in Fantasy Football. It is proven to have a higher accuracy than draft capital alone to predict fantasy success. The SPS includes 13 to 17 metrics, with the exact number varying by the player’s position. All these metrics are pre-NFL, and some are invented by us, providing a complete analysis of a player’s analytical profiles. The SPS gained widespread notoriety for its high accuracy, having made it on Barstool and The Pat McAfee Show. The SPS can be found here.
Our examination of standard statistical methods yielded the following results:
This Pearson Value indicates no strong correlation between height and future fantasy points. We are hoping for a minimum of 0.1, or an inverse correlation maximum of -0.1 when we study world-class athletes as we are. For reference to something that everyone acknowledges matters in prospect scouting, and to show the accompanying Pearson value, QB draft capital prevailed a -0.219 Pearson value.
We further extended our study by trying to find timely trends in heights for DB’s across the last 2 decades. By comparing top 10, 11-40, and bottom 10 players over 2 decades, we determined this to be a very slightly diminishing trend.
| 2004-2013 | |||
| Top 10 | 11 through 40 | Bottom 10 | |
| All count | 87 | 260 | 90 |
| All 5’10-3/8” and above | 76 | 204 | 70 |
| % (Optimal Range/all) | 87.4% | 78.5% | 77.8% |
| 2014-2023 | |||
| Top 10 | 11 through 40 | Bottom 10 | |
| All count | 93 | 281 | 93 |
| All 5’10-3/8” and above | 85 | 243 | 77 |
| % (Optimal Range/all) | 91.4% | 86.5% | 82.8% |
What 3 metrics matter the most when scouting a rookie Quarterback? What threshold should Quarterbacks achieve within those metrics to be considered an elite prospect? How much should you value those stats above all other stats? Couldn't answer those questions? Rest easy, we have it handled for you. That's what this chart answers. Sort by importance and/or filter by position. Unlock by signing up with the links provided. $9.99/Year or $24.99 Lifetime access. Cancel anytime.
While DB height has a minor statistical impact, we found an optimal range that appears in the top 10 more than the bottom 10. To go over it again; 5’10-3/8” and above is the range you should look for in athletes.
Our series has always sought to push the boundaries of sports analytics. This latest installment reaffirms our commitment to uncovering the hidden dynamics that define the game. Every Saturday, we’ll dive into intriguing questions, bust myths, and settle debates with thorough analysis. We welcome your input. Therefore, please leave comments or reach out with topics you’re eager to see dissected. All of our research can be found on our Analytics Page. Up next on our agenda for Part 29 of “Does It Matter?” is an examination of Defensive Backs Weight: Does it matter? If so, what’s the weight threshold necessary for NFL success? Mark your calendars; every Saturday we shed light on the topics that matter to you. All it takes is a quick question being asked and we will go to work for you!


BrainyBallers Buy-Hold-Sell Chart (All Players)
Get Your Products 100% Refunded By Predicting The Next SuperBowl Winner!
In our 63-part analytical series, “Does It Matter?”, we next wanted to look into the intriguing question of whether a Tight End’s

For our 61 part “Does It Matter?” series, we looked into whether a Wide Receiver’s College Yards After Catch per Reception (YAC/Rec)

In part 60 of our “Does It Matter?” series, we dove into the question of whether a college Wide Receiver’s career Average
