
Can Draft Capital Help Predict Tight End Success?
In our 63-part analytical series, “Does It Matter?”, we next wanted to look into the intriguing question of whether a Tight End’s


In Part 29 of our “Does It Matter?” series, we look to find if a Defensive Back’s weight can predict their NFL success. By crunching numbers and analyzing data from 2003 to 2023, we found an optimal range that you should hope for in your favorite athletes.
For our methodology, we examined the top 50 fantasy football finishers for each season since 2003. We looked at Cornerbacks, Free Safeties, and Strong Safeties for this research. Also, the term “bottom 10”, which you will see throughout this study, is defined as those who finished 41st to 50th each season.
Why top 50? The reason we chose the top 50 is to find a happy medium. We don’t want to go further than the top 50 and start getting close to the fringe roster players whom obviously are not going to score top 10. These players could therefore just weigh the data. On the other hand, We want to compare the worst to the best still. Comparing the top 10 to the 11th place finisher, or an average number that takes into account the 11th place finisher, doesn’t satisfy our personal itch to try to find trends.
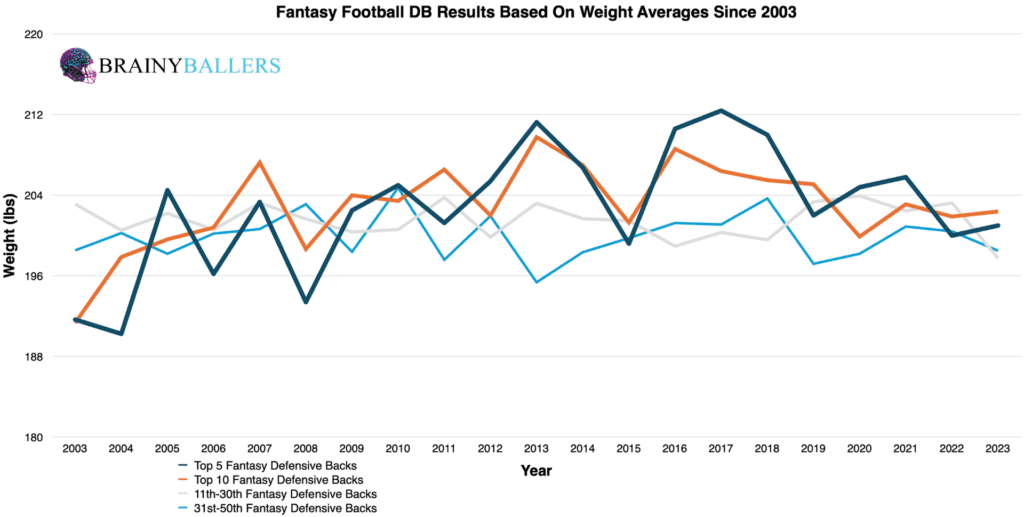
To begin finding obvious trends, we created an averages chart showcasing the weight of the top 5, top 10, 11th-30th, and 31st-50th fantasy finishes since 2003. From this, we noticed that in 81.0% of the seasons (17 out of 21), the top 10 finishers either matched, or exceeded, the weights of those in the 31st-50th positions. This suggests a potential close correlation between higher weights and better fantasy scores, as this chart has predicted in the past.
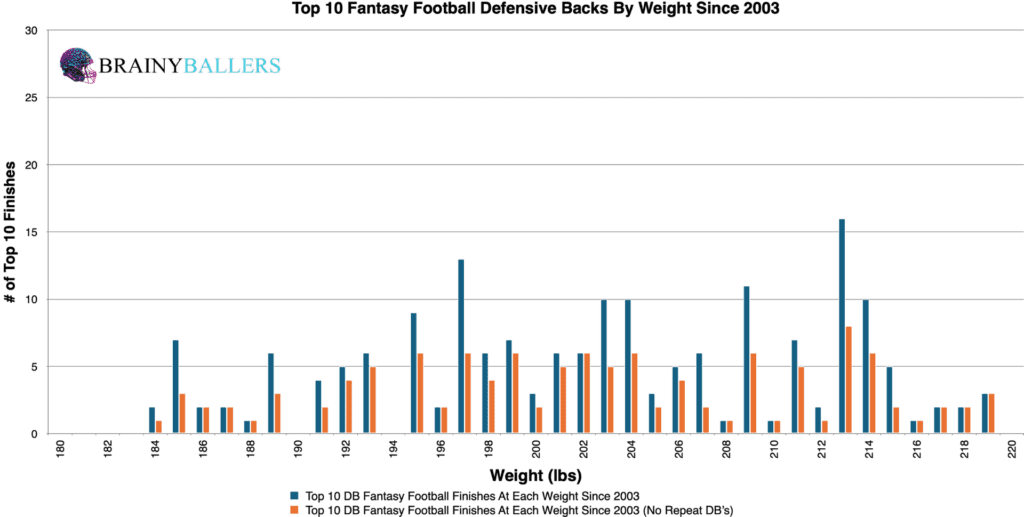
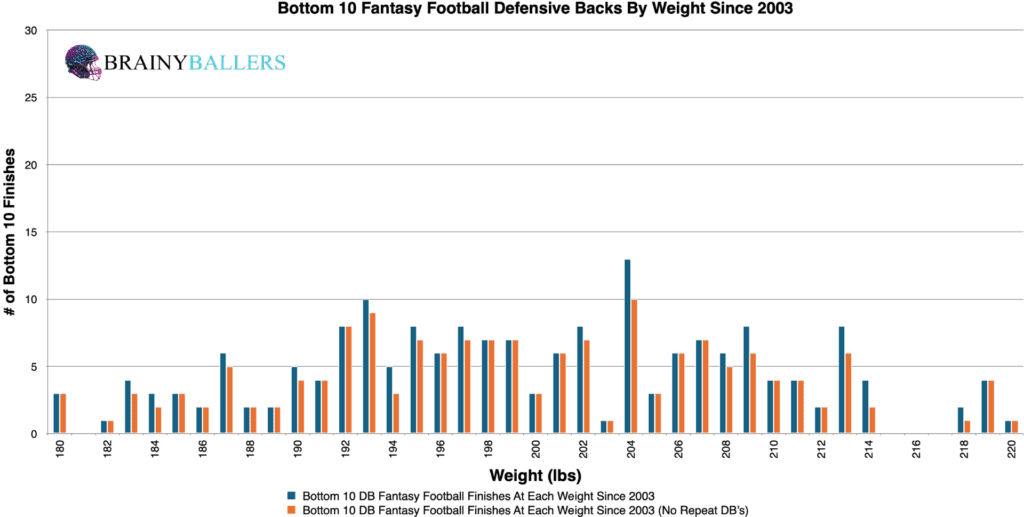
Next, we wanted to segment out the bottom and top 10 pound-by-pound to see where each chart is weighted when compared to each other. This segmentation revealed a weight towards higher weights within the more elite (top 10) group. This once again suggests a possible pattern where increased weight correlates to higher rankings within the top 10 finishers.
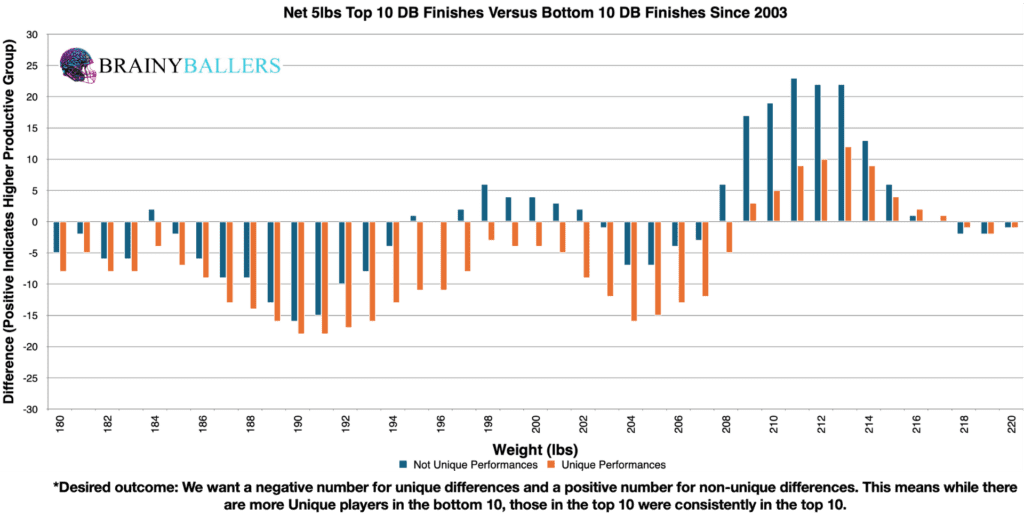
The overall goal of this research was to pinpoint the weight range where the most significant increase in performance occurs. To achieve this, a differences chart was created. This compares each weight incrementally with the next 5 pounds. Essentially, this is subtracting the bottom 10 results from the top 10 results, within each 5-pound group. The chart’s desired outcome is a negative number for unique differences (Orange) and a positive number for non-unique differences (Blue). This would indicate the desired consistent top level performances we are hoping for. From this, it became evident that a weight of 197 pounds and above is where the top performance threshold appears to be. This chart can be seen below:
Next, we looked into this range to compare it against all DBs who finished in the bottom 10 since 2003. Out of 197 DBs with NFL Combine weight data, 117 were at, or above, the 197-pound threshold, accounting for 59.4%. This percentage set the baseline for determining this as an average DB weight, or an average top-performing DB weight.
To verify if the 197-pound threshold is the top performing threshold, we next compared this range with the top 10 finishers from 2003 to 2023. Amongst 192 top 10 finishers in this time frame, 144 were within this weight range, accounting for 75.0%. This shows a 15.6% increase from the bottom 10 group. Further, after fine-tuning this range to attempt to find a higher producing range and threshold, we could not find one. Therefore, this is our optimal DB Weight range and will be the subject of this research going forward.
Due to these findings, weight could play a small factor in our Star-Predictor Score (SPS) model. Since 176lbs is the lowest seen since 2003 in the top 10, this will be the critical value for the SPS. The Star-Predictor Score (SPS) is a scouting tool designed to maximize investment potential and reduce risks when drafting rookies in Fantasy Football. It is proven to have a higher accuracy than draft capital alone to predict fantasy success. The SPS includes 13 to 17 metrics, with the exact number varying by the player’s position. All these metrics are pre-NFL, and some are invented by us, providing a complete analysis of a player’s analytical profiles. The SPS gained widespread notoriety for its high accuracy, having made it on Barstool and The Pat McAfee Show. The SPS can be found here.
We applied standard statistical analysis to measure how strong the correlation is using standard methods:
This value indicates no significant correlation between Defensive Backs weight and fantasy production. We are hoping for a minimum of 0.1, or an inverse correlation maximum of -0.1 when we study world-class athletes as we are. For reference to something that everyone acknowledges matters in prospect scouting, and to show the accompanying Pearson value, QB draft capital prevailed a -0.219 Pearson value.
The next part of our analysis involved comparing our optimal weight range across different decades for the top 10, 11th to 40th, and bottom 10 finishers. This analysis revealed no definitive trend, suggesting that weight remained as significant in the most recent decade as it did in the earlier decade.
| 2004-2013 | |||
| Top 10 | 11 through 40 | Bottom 10 | |
| All count | 89 | 273 | 90 |
| All 197lbs and above | 69 | 180 | 55 |
| % (Optimal Range/all) | 77.5% | 65.9% | 61.1% |
| 2014-2023 | |||
| Top 10 | 11 through 40 | Bottom 10 | |
| All count | 97 | 295 | 99 |
| All 197lbs and above | 73 | 203 | 58 |
| % (Optimal Range/all) | 75.3% | 68.8% | 58.6% |
What 3 metrics matter the most when scouting a rookie Quarterback? What threshold should Quarterbacks achieve within those metrics to be considered an elite prospect? How much should you value those stats above all other stats? Couldn't answer those questions? Rest easy, we have it handled for you. That's what this chart answers. Sort by importance and/or filter by position. Unlock by signing up with the links provided. $9.99/Year or $24.99 Lifetime access. Cancel anytime.
Our breakdown revealed that 197 pounds and above is the optimal range for Defensive Backs. Although there was a near miss with regression testing, if you are still a believer in weights corresponding to DB success, 197 pounds and above is the range you should be hoping for in your favorite athletes.
Our series has always sought to push the boundaries of sports analytics. This latest installment reaffirms our commitment to uncovering the hidden dynamics that define the game. Every Saturday, we’ll dive into intriguing questions, bust myths, and settle debates with thorough analysis. We welcome your input. Therefore, please leave comments or reach out with topics you’re eager to see dissected. All of our research can be found on our Analytics Page. Up next on our agenda for Part 30 of “Does It Matter?” is an examination of Defensive Back 40 Yard Dashes: Do they matter? If so, what’s the 40 Yard threshold necessary for NFL success? Mark your calendars; every Saturday we shed light on the topics that matter to you. All it takes is a quick question being asked and we will go to work for you!


BrainyBallers Buy-Hold-Sell Chart (All Players)
Get Your Products 100% Refunded By Predicting The Next SuperBowl Winner!
In our 63-part analytical series, “Does It Matter?”, we next wanted to look into the intriguing question of whether a Tight End’s

For our 61 part “Does It Matter?” series, we looked into whether a Wide Receiver’s College Yards After Catch per Reception (YAC/Rec)

In part 60 of our “Does It Matter?” series, we dove into the question of whether a college Wide Receiver’s career Average
