
Can College Yards After Catch Help Predict NFL Success For Wide Receivers?
For our 61 part “Does It Matter?” series, we looked into whether a Wide Receiver’s College Yards After Catch per Reception (YAC/Rec)


In part 8 of our “Does It Matter?” series, we skipped the already planned RB Height to explore the highly requested RB BMI correlation. Within this article, we look at the possible correlation between BMI and success in the NFL. Through fun number crunching and regression testing we pinpointed a hard threshold in BMI which closely correlates to an increase in production for NFL running backs. Here are all our findings.
Our research methodology was simple: We analyzed the top 50 fantasy football finishers since 2003. We focused exclusively on NFL draft combine numbers to maintain consistency in our data. PPR fantasy leaderboards is the league format we used due to its popularity. Throughout this study, we define the “bottom 10” as the 41st-50th place finishers in fantasy scoring each year.
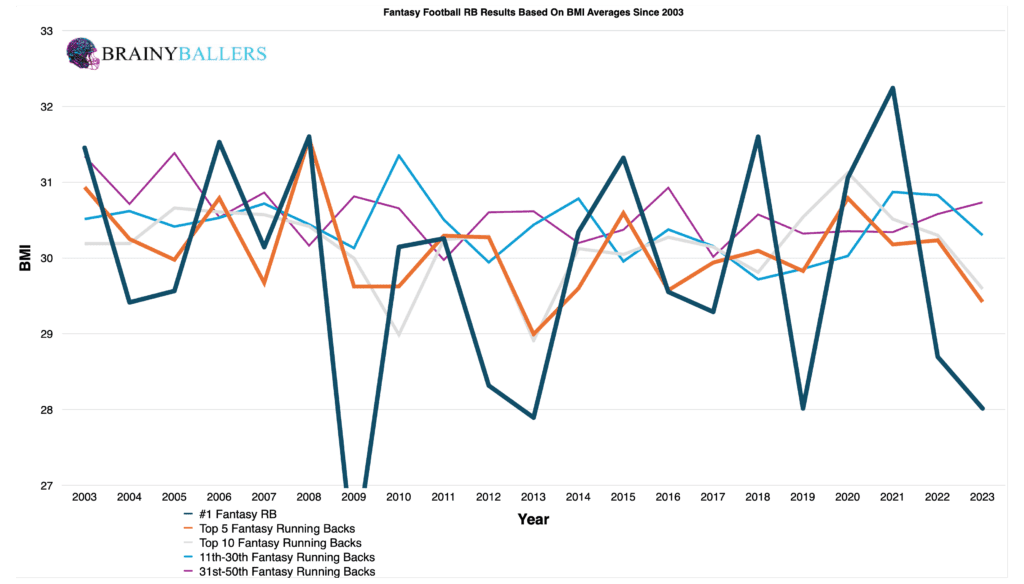
We created an averages chart to see if any obvious trends are visible. This chart included the top 1, 5, 10, 11-30th, and 31-50th place fantasy football finishers since 2003. From this, a modestly noticeable pattern emerged. The top 10 average finishers had lower BMIs compared to the 31-50th place finishers in 14/21 seasons (66%).
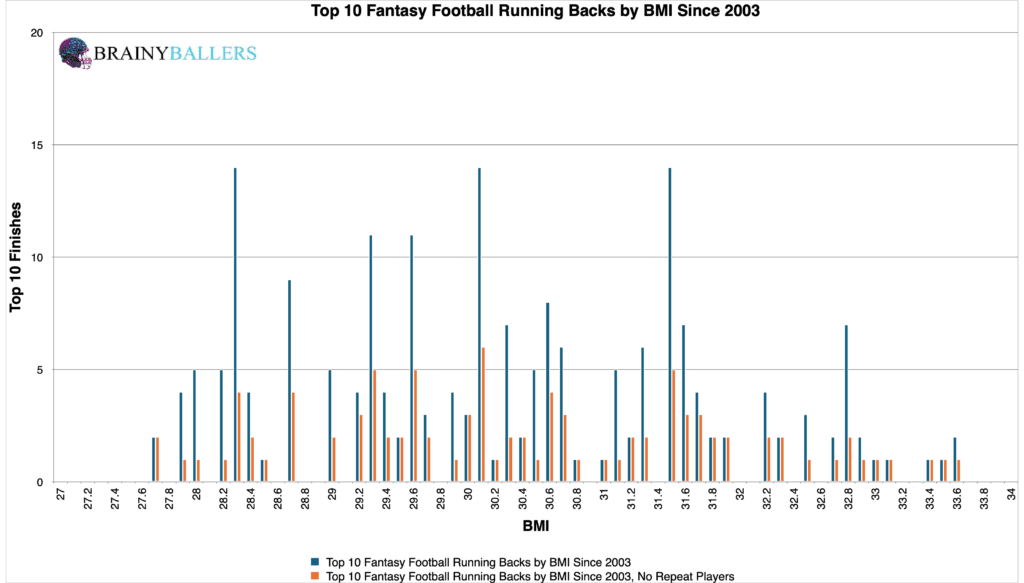
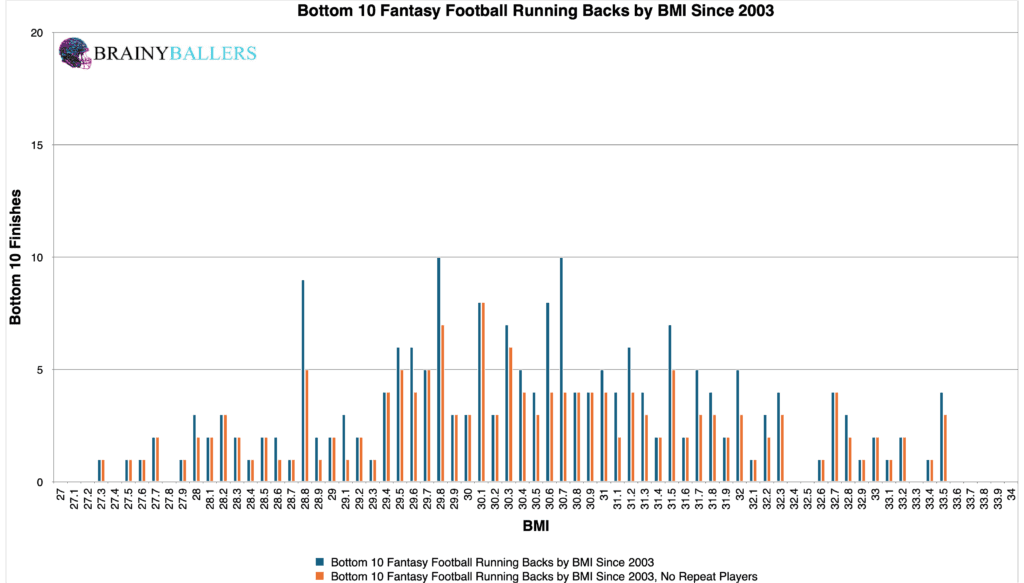
We further segmented the top 10 and bottom 10 finishers by BMI, going in increments of 0.1 BMI. Once again, the bottom 10 is defined as fantasy football finishers 41-50 each season. The top 10 chart appears to be more spread out. Although its hard to spot any trends from this chart. Those charts can be seen below:
Our goal was to find the BMI range that leads to the most top level performance. This led us to create a differences chart that highlighted the optimal BMI range. In this chart, you will see both unique (green) and non-unique players (blue) that showed up in our data. The chart’s desired outcome is a negative number for unique differences and a positive number for non-unique differences. This desired outcome would show that when NFL Running Backs show up in the top 10, they are most likely to appear in the top 10 again.
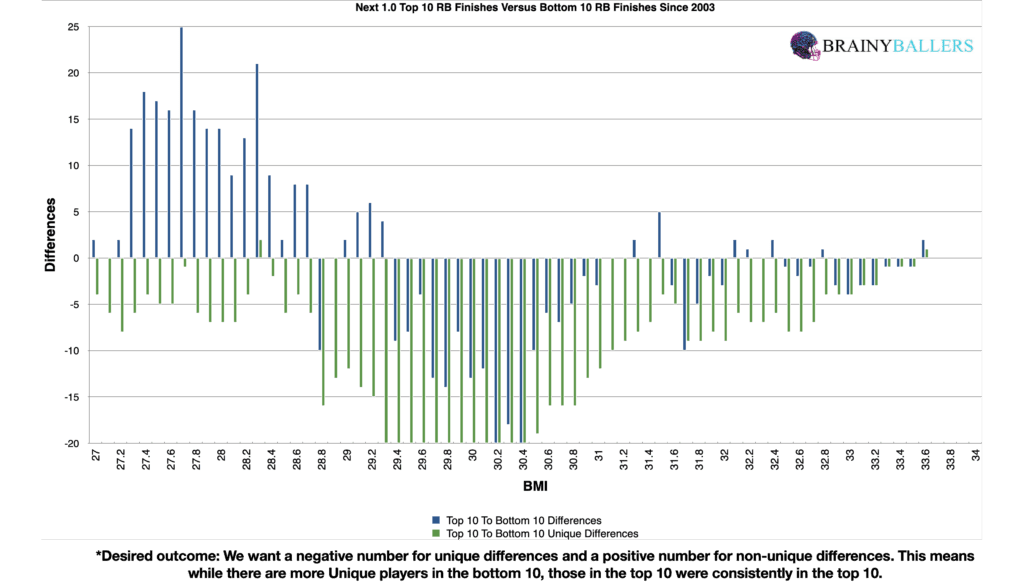
This chart pointed to 29.3 as the critical threshold – signaling that BMIs below 30.3 (after adding the 1.0 difference) is the cutoff for top level consistency.
The Next 1.0 BMI difference chart proved to be very insightful. This established the pivotal threshold of 30.3 and below as the threshold of consistent performance excellence. Therefore, the spotlight for the rest of this study will now be fixed on the sub-30.3 BMI threshold.
To further quantify the impact of BMI on an NFL Running Backs’ fantasy points, we conducted standard statistical testing which yielded encouraging results. For the Pearson value, it came back as -0.102, indicating there is correlation between the two variables (BMI and fantasy points in this case). We are hoping for a minimum of 0.1, or an inverse correlation maximum of -0.1 while studying world-class athletes as we are. For reference to something that everyone acknowledges matters in prospect scouting, and to show the accompanying Pearson value, RB draft capital prevailed a -0.234 Pearson value.
Due to these findings, BMI could play a factor in our Star-Predictor Score (SPS) model. The Star-Predictor Score (SPS) is a scouting tool designed to maximize investment potential and reduce risks when drafting rookies in Fantasy Football. It is proven to have a higher accuracy than draft capital alone to predict fantasy success. The SPS includes 13 to 17 metrics, with the exact number varying by the player’s position. All these metrics are pre-NFL, and some are invented by us, providing a complete analysis of a player’s analytical profiles. The SPS gained widespread notoriety for its high accuracy, having made it on Barstool and The Pat McAfee Show. The SPS can be found here.
Diving deeper into the numbers, we wanted to see how frequently this BMI occurs in all Bottom 10 RB’s so we can compare that frequency to the top 10. Out of the 210 RBs who finished bottom 10 from 2003-2023, 46.7% fell within the coveted sub-30.3 BMI range. This sets the baseline for comparing to the top 10. If more than 46.7% occurs in the top 10, then we found a BMI that occurs at higher rates in the top 10. Since 2003, 118 of 210 top 10 RB’s had a sub-30.3 BMI. This accounts for 56.2% of top 10 performers which showcases a 9.5% increase in the frequency which this BMI shows up in the top 10.
Shifting our focus to different timeframes, we looked to uncover any emerging patterns or trends. The data compared the periods 2004-2013 and 2014-2023. The breakdown of both decades is shown below:
| 2004-2013 | |||
| Top 10 | 11 through 40 | Bottom 10 | |
| All count | 100 | 300 | 100 |
| All At or Below 30.3 | 62 | 153 | 42 |
| % (At or below 30.3/All) | 62.0% | 51.0% | 42.0% |
| 2014-2023 | |||
| Top 10 | 11 through 40 | Bottom 10 | |
| All count | 100 | 300 | 100 |
| All At or Below 30.3 | 49 | 140 | 49 |
| % (At or below 30.3/All) | 49.0% | 46.7% | 49.0% |
From what our overall research has revealed, a contrasting trend emerged in the later decade. Here you can see the percentages were very similar for all NFL Running Backs across fantasy leaderboards. This could be signaling a potential shift in league preferences towards a different BMI profile, whether intentional or not.
What 3 metrics matter the most when scouting a rookie Quarterback? What threshold should Quarterbacks achieve within those metrics to be considered an elite prospect? How much should you value those stats above all other stats? Couldn't answer those questions? Rest easy, we have it handled for you. That's what this chart answers. Sort by importance and/or filter by position. Unlock by signing up with the links provided. $9.99/Year or $24.99 Lifetime access. Cancel anytime.
Our analysis has revealed that having a BMI under 30.3 is the BMI which shows up most frequently in the top 10. With this being backed by regression testing and when we compare this BMI to the bottom producers, this BMI threshold looks to be a metric that can supplement player evaluations. Although, it can be said that it should be taken with a grain of salt, as the most recent decade does not have a substantial frequency increase in how much this BMI showed up in the top 10 versus the bottom 10.
Our series has always sought to push the boundaries of sports analytics, and this latest installment reaffirms our commitment to uncovering the hidden dynamics that define the game. Every Saturday We will dive deep into the most intriguing questions, bust myths, and settle debates with thorough analysis similar to this. We thrive on curiosity and welcome your input — so please, leave comments or reach out to us with topics you’re eager to see dissected next. All of our research can be found on our Analytics Page. Up next on our agenda for Part 9 of “Does It Matter?” is our next examination of Running Backs: Does Height matter? If so, what’s the ideal height for a RB? Mark your calendars; every Saturday we shed light on the topics that matter to you. All it takes is a short question and we will go to work for you!


For our 61 part “Does It Matter?” series, we looked into whether a Wide Receiver’s College Yards After Catch per Reception (YAC/Rec)

In part 60 of our “Does It Matter?” series, we dove into the question of whether a college Wide Receiver’s career Average

The “Does It Matter?” series, part 59 looked to uncover the role of a quarterback’s rookie touchdown per game (TD/G) in predicting
