
Can College Yards After Catch Help Predict NFL Success For Wide Receivers?
For our 61 part “Does It Matter?” series, we looked into whether a Wide Receiver’s College Yards After Catch per Reception (YAC/Rec)


For part 9 of our “Does It Matter?” series, we looked into whether height matters for NFL running backs. After finding a correlation in part 8 for RB BMI, In this article we unearth a specific height range that is directly linked to increased top level consistent production on the field. Here are all our findings.
We analyzed the top 50 fantasy football finishers since 2003. We focused exclusively on NFL draft combine numbers to maintain consistency in our data. The PPR fantasy scoring system is what we used due to its popularity. Additionally, throughout this study we refer to the “Bottom 10”. This is defined as the 41st-50th place finishers in fantasy scoring each year.
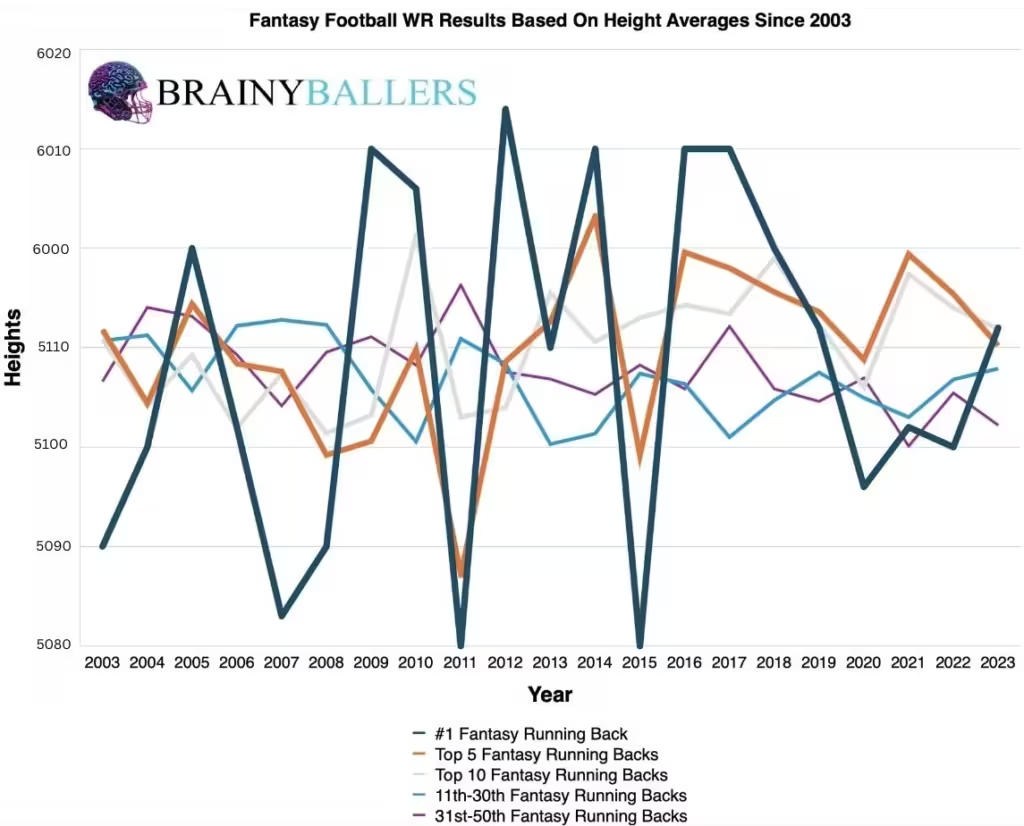
We first wanted to look at our averages chart that compares heights across different Running Back finisher categories. The insights were appealing – the top 5 finishers consistently had taller heights compared to those at the bottom of the rankings for 71.4% of seasons since 2003. That averages chart where that is seen can be seen below:
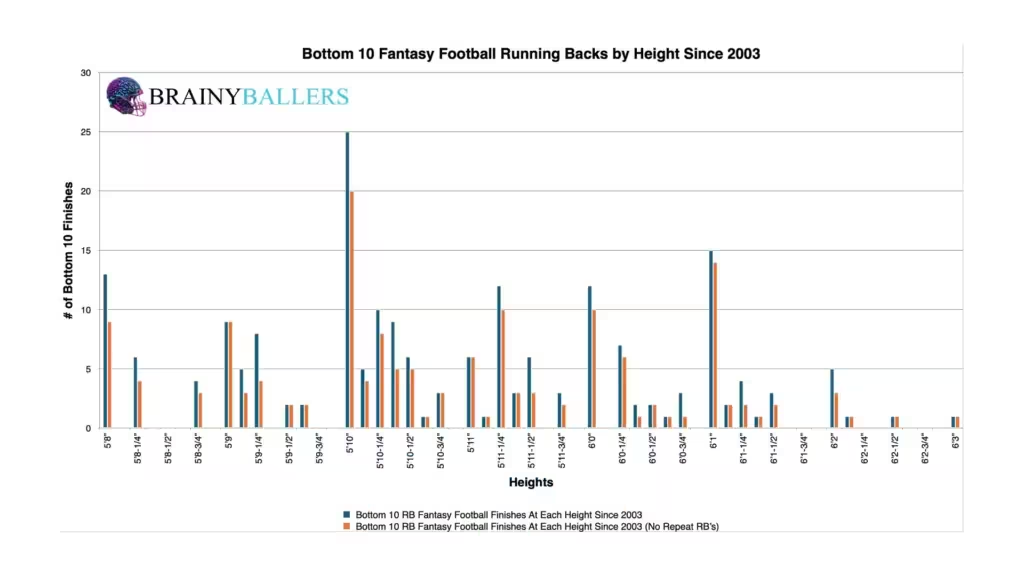
Zooming in further, we wanted to segment out the top 10 finishes amongst NFL Running Backs to view their heights in 1/8″ increments. When we did this, we discovered significant increases in production at a couple specific heights when comparing to the bottom 10. Notably, 6’0″ and 6’1″ showed the most significant increase in performance going from the bottom 10 to the top 10, hinting at a potential hard range. These charts can be seen below:
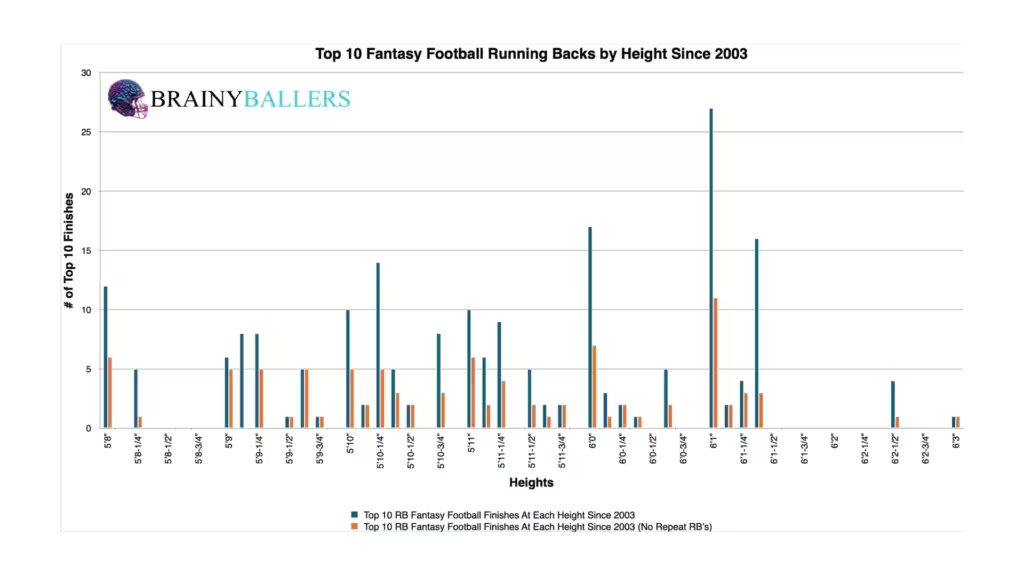
Throughout this series, the differences chart has emerged as a crucial tool in our analysis. This helps pinpoint sweet spot ranges where performances not only peak, but shows us top level production consistency. Essentially, we can use this to see what heights prevailed more than just the “one hit wonders” of the NFL. In this chart, you will see both unique (orange) and non-unique players (blue) that showed up in our data. The chart’s desired outcome is a negative number for unique differences and a positive number for non-unique differences. This desired outcome would show that when NFL Running Backs show up in the top 10, they are most likely to appear in the top 10 again.
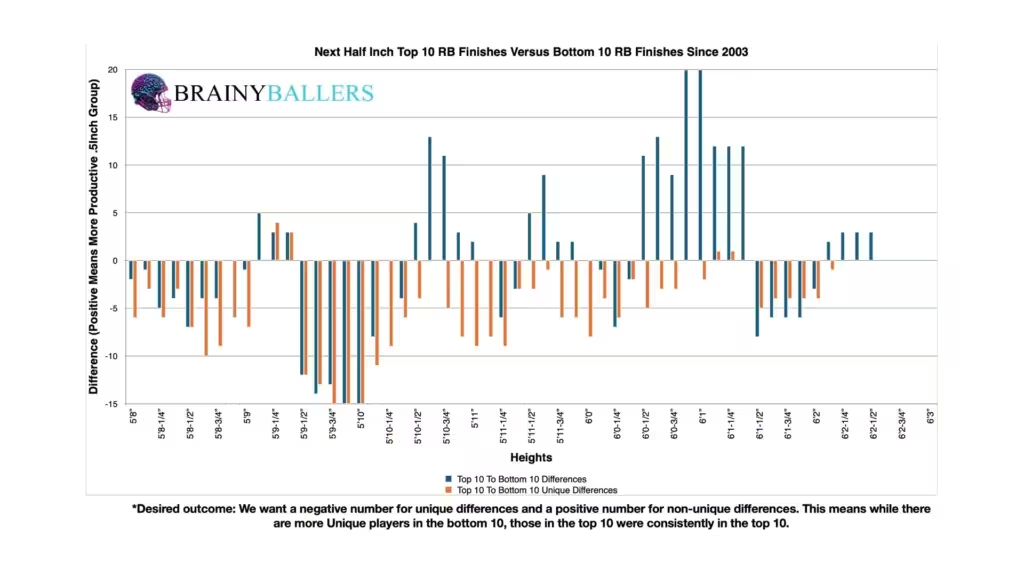
With this chart, we identified a critical height range – from 6’0.5″ to 6’1.875″. This is where the highest increases occur from the top 10 compared to the bottom 10. We also identified a soft range from this ranging from 5’10.5″ to 6’0.5″. The soft range is where a smaller increase occurs, just not the more significant sweet spot. The hard range will be the focus of this study going forward, as it shows the most high-level and consistent production increase.
Our standard statistical testing did not come back as a strong correlation. Here are those results:
This indicates there is no correlation between height and fantasy points. We are hoping for a minimum of 0.1, or an inverse correlation maximum of -0.1 while studying world-class athletes as we are. For reference to something that everyone acknowledges matters in prospect scouting, and to show the accompanying Pearson value, RB draft capital prevailed a -0.234 Pearson value.
Due to these findings, Height could play a small factor in our Star-Predictor Score (SPS) model. The Star-Predictor Score (SPS) is a scouting tool designed to maximize investment potential and reduce risks when drafting rookies in Fantasy Football. It is proven to have a higher accuracy than draft capital alone to predict fantasy success. The SPS includes 13 to 17 metrics, with the exact number varying by the player’s position. All these metrics are pre-NFL, and some are invented by us, providing a complete analysis of a player’s analytical profiles. The SPS gained widespread notoriety for its high accuracy, having made it on Barstool and The Pat McAfee Show. The SPS can be found here.
To dive deeper into our findings, we wanted to compare our height range against all top and bottom 10 finishers. This could show us whether we found an average RB’s height, or an average top performing RB’s height. For the bottom 10, out of 210 running backs, 31 fell within this height range which accounts for 14.8%. This sets our baseline for comparing back to the top 10. If more than 14.8% appeared in the top 10, then we found the most frequent top performing RB’s height and not just an average RB’s height. When looking at the top 10 finishers, 54 out of 210 were within the same range. This represents 25.7%, a significant 10.9% increase when compared to the bottom 10 finishers!
Since we found this 10.9% trend, we wanted to look into time based trends. Therefore we split all of our data into two decades and ran the same exact calculations as we did for all of the data where we found that 10.9% increase.
| 2004-2013 | |||
| Top 10 | 11 through 40 | Bottom 10 | |
| All count | 100 | 300 | 100 |
| Between 5’10.5” to 6’0.5” | 26 | 121 | 29 |
| % (soft zone/all) | 26.0% | 40.3% | 29.0% |
| Between 6’0.5” to 6’1.875” | 28 | 51 | 21 |
| % (hard zone/all) | 28.0% | 17.0% | 21.0% |
| 2014-2023 | |||
| Top 10 | 11 through 40 | Bottom 10 | |
| All count | 100 | 300 | 100 |
| Between 5’10.5” to 6’0.5” | 36 | 102 | 29 |
| % (soft zone/all) | 36.0% | 34.0% | 29.0% |
| Between 6’0.5” to 6’1.875” | 25 | 44 | 7 |
| % (hard zone/all) | 25.0% | 14.7% | 7.0% |
A noticeable trend emerges which indicates a shift towards our identified height range in the most recent decade. In the 2004-2013 decade, there is a 7% increase from the bottom 10 to the top 10. As you can see in the most recent decade there is a glaring 18% increase which is where we arrived to that conclusion of this height range being a more recent trend.
What 3 metrics matter the most when scouting a rookie Quarterback? What threshold should Quarterbacks achieve within those metrics to be considered an elite prospect? How much should you value those stats above all other stats? Couldn't answer those questions? Rest easy, we have it handled for you. That's what this chart answers. Sort by importance and/or filter by position. Unlock by signing up with the links provided. $9.99/Year or $24.99 Lifetime access. Cancel anytime.
In conclusion, our number crunching has revealed a connection between height and RB success. The hard range we’ve uncovered appears 10.9% more frequently in the top 10 versus the bottom 10.
If you want to use this data to your advantage, here’s what it means as far as its applicability: Running backs within the hard height range who are projected to be in the top 50 have a 10.9% higher chance of ending the season in the top 10 rather than at the bottom of the leaderboard.
Our series has always sought to push the boundaries of sports analytics, and this latest installment reaffirms our commitment to uncovering the hidden dynamics that define the game. Every Saturday We will dive deep into the most intriguing questions, bust myths, and settle debates with thorough analysis similar to this. We thrive on curiosity and welcome your input — so please, leave comments or reach out to us with topics you’re eager to see dissected next. All of our research can be found on our Analytics Page. Up next on our agenda for Part 10 of “Does It Matter?” is our next examination of NFL Running Backs: Does 40 time matter? If so, what’s the 40 time threshold necessary for success? Mark your calendars; every Saturday we shed light on the topics that matter to you. All it takes is a quick question being asked and we will go to work for you!


For our 61 part “Does It Matter?” series, we looked into whether a Wide Receiver’s College Yards After Catch per Reception (YAC/Rec)

In part 60 of our “Does It Matter?” series, we dove into the question of whether a college Wide Receiver’s career Average

The “Does It Matter?” series, part 59 looked to uncover the role of a quarterback’s rookie touchdown per game (TD/G) in predicting
