
Can College Yards After Catch Help Predict NFL Success For Wide Receivers?
For our 61 part “Does It Matter?” series, we looked into whether a Wide Receiver’s College Yards After Catch per Reception (YAC/Rec)


In our 13th entry to the “Does It Matter?” series, we dove into the data to discover if there’s a correlation between NFL Wide Receiver 40 times and success. What we found surprised us, and it may surprise you as well:
Just as usual, we analyzed data from the NFL Combine to ensure consistency, focusing on the top 50 PPR fantasy football finishers from 2003 to 2023. Throughout this article you will see “bottom 10” which is defined as fantasy football finishers 41-50. To get a clear picture of performance trends, we created an averages chart which focuses on 4 different areas:
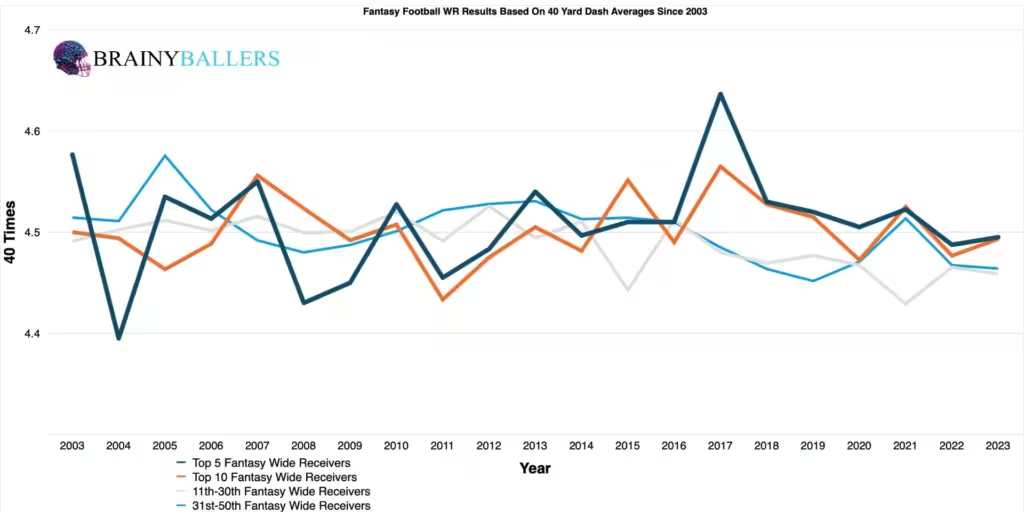
As you can see, it is extremely difficult to visualize any trend here. That’s when doubts began to creep in regarding the importance of 40-yard dash times in predicting success for Wide Receivers.
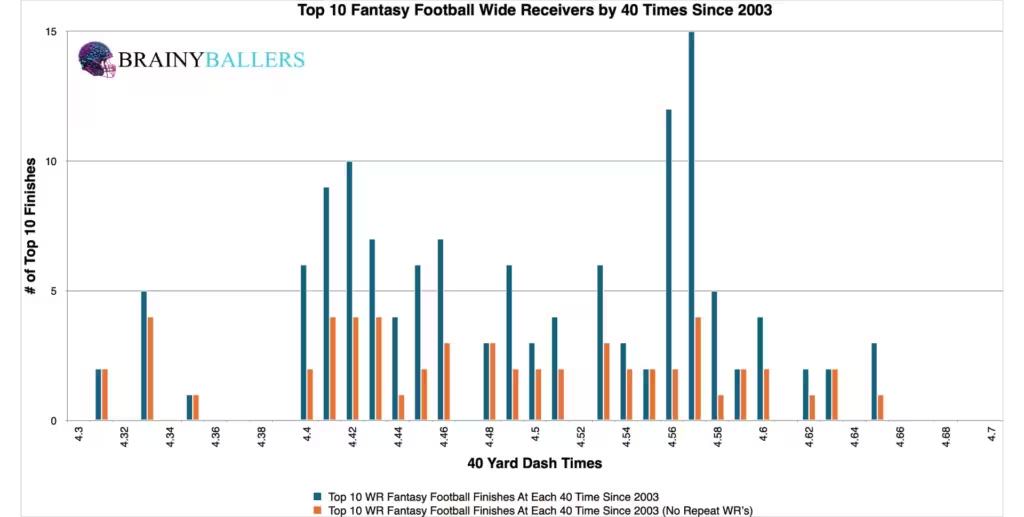
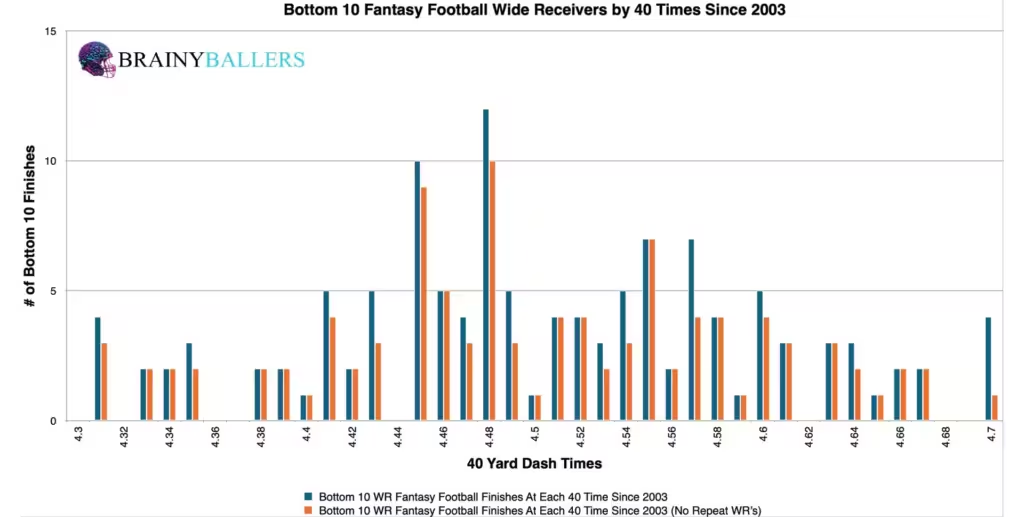
While we found no general trend in average performances, we wanted to segment the top and bottom 10 finishers by 0.01-second 40-yard dash increments. This could lead us to visualize where the greatest increases occur. As you can see, the largest top performance increases occur at 4.56 and 4.57 seconds. Further, there appears to be more WR’s under 4.4 seconds in the bottom 10 chart. Those charts can be seen below:
When we looked into our differences chart, the confusion and concern for finding a trend/correlating data built up even more. This was due to seeing two ranges of increased top level performance. The purpose of this chart is to find a threshold, or range, where increased consistent top level producers occur. This is done by comparing the top 10 and bottom 10 charts, then including the next 0.05 seconds at each indicated interval. The chart’s desired outcome is a negative number for unique differences (Orange) and a positive number for non-unique differences (Blue). This would indicate the desired consistent top level performances we are hoping for. Here are the two major increases the differences chart revealed:
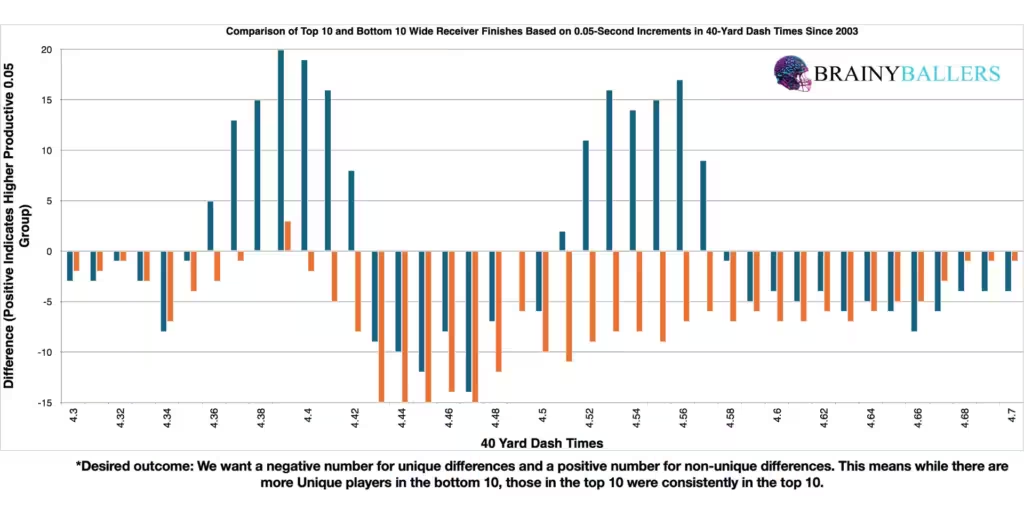
Despite the clear increases, we expected a single peak chart like our WR BMI differences chart shown here.
Typically, we would first compare the frequency of NFL Wide Receivers 40-yard dash times between the bottom 10 and top 10 groups. Since these have been skeptical findings thus far, we ran standard statistical tests first this week. Shockingly, our standard testing displayed an extremely low correlation between 40-yard dash times and fantasy production. With a sample of 702, the Pearson of 0.004 revealed no correlation between 40-times and fantasy points.
This weak WR data indicates that the 40-yard dash is not a reliable predictor of WR success in terms of fantasy production. In research concerning elite athletes like this, a Pearson value over 0.1 or under -0.1 is significant for indicating predictive power. For reference to something that everyone acknowledges matters in prospect scouting, and to show the accompanying Pearson value, RB draft capital prevailed a -0.234 Pearson value. Therefore, this shows that BMI can be used as a helpful predictor to aid in deciding between multiple Wide Receivers.
Despite proving no correlation between NFL Wide Receivers 40 times and success, we still wanted to check how often the best group (4.36-4.47) appeared in the top 10 versus the bottom 10. To start, We analyzed the 40-yard dash times of WRs finishing in the bottom 10 (41st-50th place) every season from 2003-2023. Out of 127 WRs, 36 fell within the 4.36 to 4.47 second range, accounting for 28.3%. This established our baseline for comparison with top-performing WRs.
If more than 28.3% occurs in the top 10, then we found an average top-performing WR 40-yard dash time. In the top 10, there were 135 athletes who ran the 40-yard dash at the NFL Combine. 49 of these athletes had a 40-yard dash time within our range, representing 36.3% and a 7.9% increase over the bottom 10 results.
To ensure we found the top-producing range, we used our spreadsheet to make quick range adjustments to accurately identify the highest performing 40-time. From that, we found that adjusting the range to 4.32 to 4.44 seconds results in a 12.2% increase in the top 10 frequency compared to the bottom 10’s frequency. Therefore, this will be the subject of this research going forward.
Due to these findings, the 40-yard dash could play a small factor only in our Star-Predictor Score (SPS) model. The Star-Predictor Score (SPS) is a scouting tool designed to maximize investment potential and reduce risks when drafting rookies in Fantasy Football. It is proven to have a higher accuracy than draft capital alone to predict fantasy success. The SPS includes 13 to 17 metrics, with the exact number varying by the player’s position. All these metrics are pre-NFL, and some are invented by us, providing a complete analysis of a player’s analytical profiles. The SPS gained widespread notoriety for its high accuracy, having made it on Barstool and The Pat McAfee Show. The SPS can be found here.
Next, we wanted to segment our data into two decades to spot any emerging trends. By dividing finishers into three categories – top 10, 11th to 40th, and bottom 10 – we noticed that any existing trends within the range we identified weakened over the more recent decade. This suggests that 40-yard dash times may be becoming even less effective as a performance predictor in today’s NFL.
| 2004-2013 | |||
| Top 10 | 11 through 40 | Bottom 10 | |
| All count | 56 | 206 | 75 |
| Between 4.32 to 4.44 | 19 | 52 | 15 |
| % (hard zone/all) | 33.9% | 25.2% | 20.0% |
| 2014-2023 | |||
| Top 10 | 11 through 40 | Bottom 10 | |
| All count | 73 | 217 | 70 |
| Between 4.32 to 4.44 | 21 | 90 | 15 |
| % (hard zone/all) | 28.8% | 41.5% | 21.4% |
What 3 metrics matter the most when scouting a rookie Quarterback? What threshold should Quarterbacks achieve within those metrics to be considered an elite prospect? How much should you value those stats above all other stats? Couldn't answer those questions? Rest easy, we have it handled for you. That's what this chart answers. Sort by importance and/or filter by position. Unlock by signing up with the links provided. $9.99/Year or $24.99 Lifetime access. Cancel anytime.
In this extensive research, we explored the relationship between 40-yard dash times and NFL wide receiver performances, specifically focusing on fantasy football finishing positions. Although the 12.2% increase in top performers which fell within the 4.32. to 4.44 seconds range was exciting, the lack of statistical support from our regression testing suggests this might be more about luck than skill. This was shocking, as we had anticipated 40 yard dashes to be a near paramount metric for NFL Wide Receivers. We are now expecting an increase of significance in these burst metrics such as 10 yard splits, 3-cones, and shuttle drills. This could be perhaps due to help getting off the line and route running skills.
Our series has always sought to push the boundaries of sports analytics. This latest installment reaffirms our commitment to uncovering the hidden dynamics that define the game. Every Saturday, we’ll dive into intriguing questions, bust myths, and settle debates with thorough analysis. We welcome your input. Therefore, please leave comments or reach out with topics you’re eager to see dissected. All of our research can be found on our Analytics Page. Up next on our agenda for Part 14 of “Does It Matter?” is an examination of WR 10 Yard splits: Do they matter? If so, what’s the 10 yard split threshold necessary for success? Mark your calendars; every Saturday we shed light on the topics that matter to you. All it takes is a quick question being asked and we will go to work for you!


For our 61 part “Does It Matter?” series, we looked into whether a Wide Receiver’s College Yards After Catch per Reception (YAC/Rec)

In part 60 of our “Does It Matter?” series, we dove into the question of whether a college Wide Receiver’s career Average

The “Does It Matter?” series, part 59 looked to uncover the role of a quarterback’s rookie touchdown per game (TD/G) in predicting
