
Can Draft Capital Help Predict Tight End Success?
In our 63-part analytical series, “Does It Matter?”, we next wanted to look into the intriguing question of whether a Tight End’s


For our ongoing 12 part “Does It Matter?” series, this week we dove into the numbers to see if Body Mass Index (BMI) could be used to predict the success of NFL wide receivers. After analyzing historical data, we found a BMI threshold correlating which has an increased production. Here’s a comprehensive analysis of our process and findings.
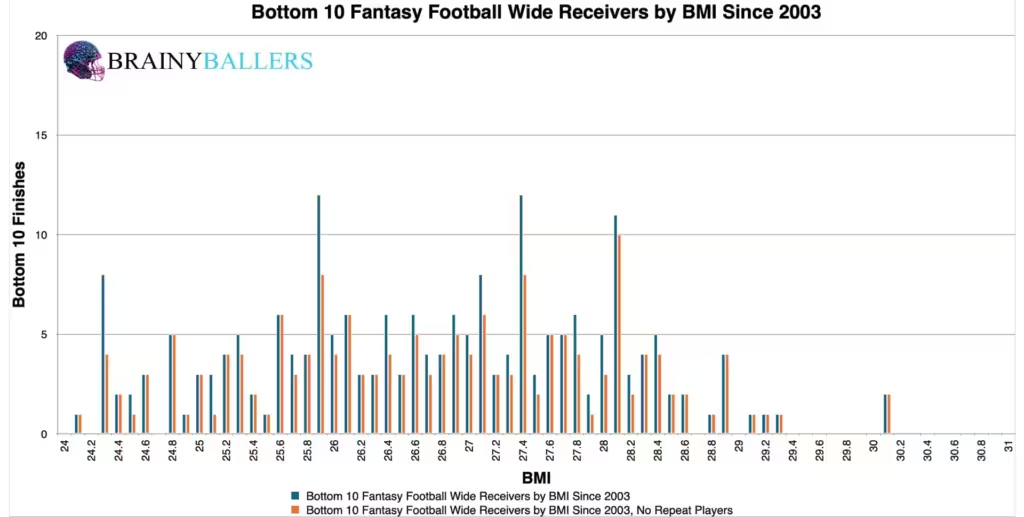
To ensure consistency, our study focused on the top 50 fantasy football finishers since 2003, exclusively using NFL Draft Combine numbers. We used PPR fantasy scores for our data and rounded each BMI to the nearest 0.1 for simplicity. Throughout this article you will see “bottom 10” which is defined as fantasy football finishers 41-50.
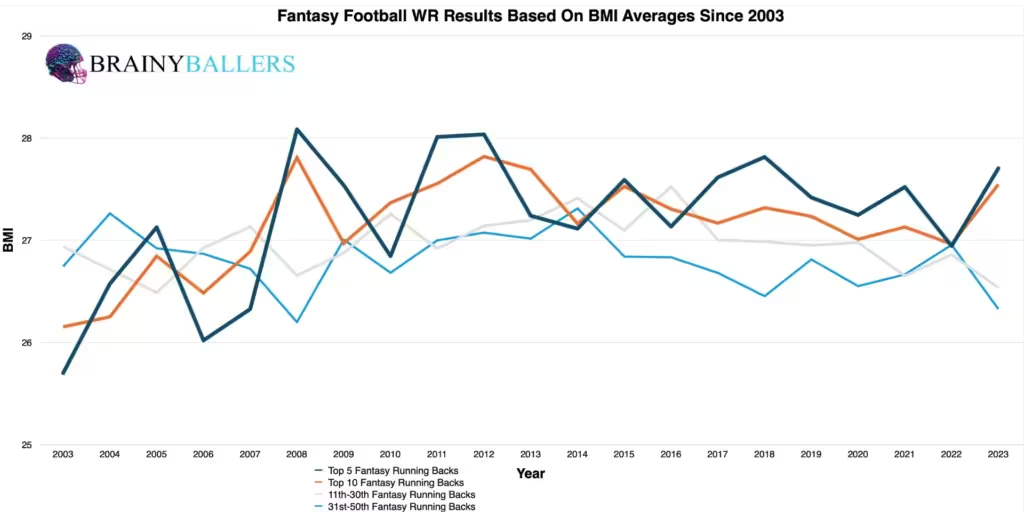
We compiled averages for the top 1, 5, 10, 11-30th, and 31-50th finishers since 2003. This data revealed that the top 5 finishers boasted higher BMIs compared to the 31-50th finishers in 15 out of 21 seasons, accounting for 71.4%. The consistency in these averages suggested that BMI could play a role in WR success.
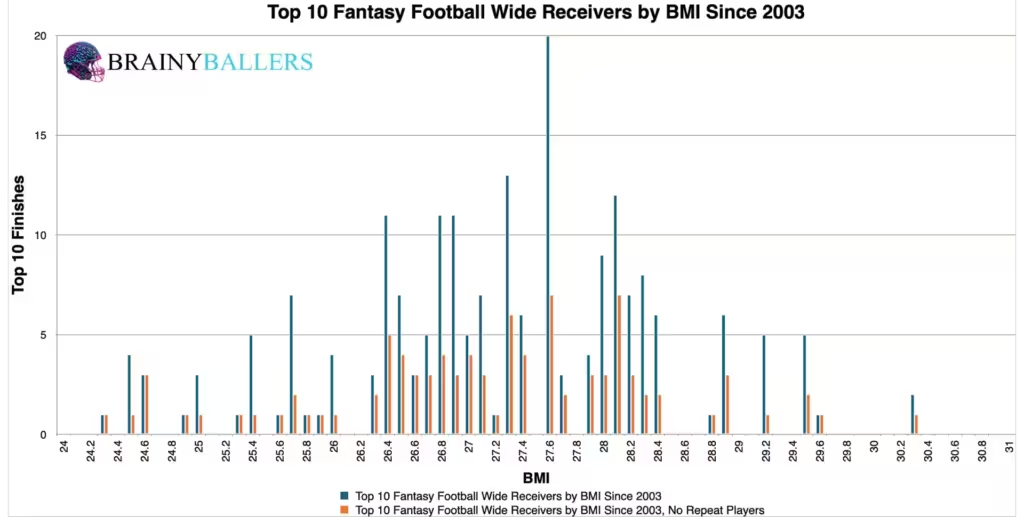
We segmented the top 10 and bottom 10 finishers into 0.1 BMI increments and compared both charts. This aimed to visualize where performance significantly increases. As you can see, both charts look unimodal, although the top 10 looks more weighted around higher BMI’s.
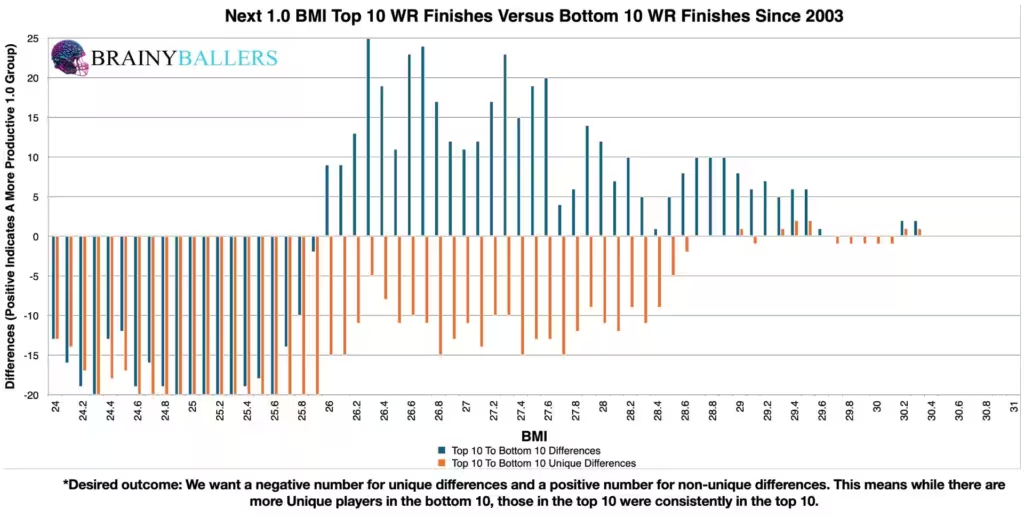
We created a differences chart comparing each BMI plus the next 1.0 by subtracting the bottom 10 results from the top 10. The purpose of this chart is to find a threshold, or range. The chart’s desired outcome is a negative number for unique differences (Orange) and a positive number for non-unique differences (Blue). This would indicate consistent top level performance. Overwhelmingly positive numbers after a BMI of 26.0 established this as our preferred threshold. Therefore, a BMI of 26.0 became the focus of our study going forward.
To establish a baseline, we analyzed WRs who finished in the bottom 10 (41st to 50th place) by fantasy points from 2003 to 2023. Out of 210 WRs in this range, 143 had a BMI at or above 26.0. This accounts for 68.1% and established our baseline for what could be considered an “average” WR’s BMI threshold. If more than 68.1% occurs in the top 10, then we found a BMI that occurs more frequently. For the top 10, these 210 WRs had 177 with a BMI above 26.0. This equates to 84.3%. and marked a significant 16.2% increase from the bottom 10 finishers! This suggests that a higher BMI is a common trait among top-performing WRs.
To make sure we found the optimal range, we upgraded our spreadsheet to quickly adjust and test various BMI ranges. This allowed us to efficiently identify the threshold which produces the highest percentage of top 10 finishes. Through this, we realized that altering the range to 26.3 BMI and above resulted in a 21.0% increased appearance rate in the top 10 when compared to the bottom 10 since 2003. Therefore, this range will be the subject of this research going forward and will be our optimal range for Wide Receiver BMI.
Due to these findings, BMI could play a factor in our Star-Predictor Score (SPS) model. The Star-Predictor Score (SPS) is a scouting tool designed to maximize investment potential and reduce risks when drafting rookies in Fantasy Football. It is proven to have a higher accuracy than draft capital alone to predict fantasy success. The SPS includes 13 to 17 metrics, with the exact number varying by the player’s position. All these metrics are pre-NFL, and some are invented by us, providing a complete analysis of a player’s analytical profiles. The SPS gained widespread notoriety for its high accuracy, having made it on Barstool and The Pat McAfee Show. The SPS can be found here.
We also compared BMI thresholds across different finishers categories (top 10, 11-40th place, and bottom 10) over the last two decades. The following insights can be seen:
| 2004-2013 | |||
| Top 10 | 11 through 40 | Bottom 10 | |
| All count | 100 | 300 | 100 |
| All 26.3 and above | 81 | 228 | 65 |
| % (Optimal Range/all) | 81.0% | 76.0% | 65.0% |
| 2014-2023 | |||
| Top 10 | 11 through 40 | Bottom 10 | |
| All count | 100 | 300 | 100 |
| All 26.3 and above | 87 | 222 | 57 |
| % (Optimal Range/all) | 87.0% | 74.0% | 57.0% |
To solidify our findings, we ran standard statistical tests comparing BMI to fantasy points. That can be seen below:
This indicates a meaningful positive relationship between BMI and future fantasy production, meaning higher Body Mass Indexes typically have higher NFL fantasy scores. In research concerning elite athletes like this, a Pearson value over 0.1 or under -0.1 is significant for indicating predictive power. For reference to something that everyone acknowledges matters in prospect scouting, and to show the accompanying Pearson value, RB draft capital prevailed a -0.234 Pearson value. Therefore, this shows that BMI can be used as a helpful predictor to aid in deciding between multiple Wide Receivers.
What 3 metrics matter the most when scouting a rookie Quarterback? What threshold should Quarterbacks achieve within those metrics to be considered an elite prospect? How much should you value those stats above all other stats? Couldn't answer those questions? Rest easy, we have it handled for you. That's what this chart answers. Sort by importance and/or filter by position. Unlock by signing up with the links provided. $9.99/Year or $24.99 Lifetime access. Cancel anytime.
Our thorough examination revealed BMI as a predictor of WR success in the NFL. A BMI threshold of 26.3 corresponds to a 21.0% increase in production from the bottom 10 to the top 10 fantasy finishers between 2003 and 2023. This was accompanied by a great Pearson Value.
Our series has always sought to push the boundaries of sports analytics, and this latest installment reaffirms our commitment to uncovering the hidden dynamics that define the game. Every Saturday We will dive deep into the most intriguing questions, bust myths, and settle debates with thorough analysis similar to this. We thrive on curiosity and welcome your input — so please, leave comments or reach out to us with topics you’re eager to see dissected. All of our research can be found on our Analytics Page. Up next on our agenda for Part 13 of “Does It Matter?” is an examination of WR 40 Yard Dashes: do they matter? If so, what’s the 40 time threshold necessary for success? Mark your calendars; every Saturday we shed light on the topics that matter to you. All it takes is a quick question being asked and we will go to work for you!


In our 63-part analytical series, “Does It Matter?”, we next wanted to look into the intriguing question of whether a Tight End’s

For our 61 part “Does It Matter?” series, we looked into whether a Wide Receiver’s College Yards After Catch per Reception (YAC/Rec)

In part 60 of our “Does It Matter?” series, we dove into the question of whether a college Wide Receiver’s career Average
