
Can Draft Capital Help Predict Tight End Success?
In our 63-part analytical series, “Does It Matter?”, we next wanted to look into the intriguing question of whether a Tight End’s


In the 62nd installment of our “Does It Matter?” series, we looked into Relative Athletic Score (RAS) to determine its effectiveness in predicting wide receiver success in fantasy football. Here’s what we found.
Relative Athletic Score (RAS) is a metric used to evaluate the athleticism of NFL prospects based on their performances in Combine and Pro Day drills. Developed by Kent Lee Platte in 2013, RAS takes various physical attributes such as speed, agility, explosiveness, and size to normalize them on a scale from 0 to 10. The results are then color-coded to provide a quick visual comparison of a player’s athletic traits relative to other players of the same position. This system helps teams and analysts quickly assess the athletic potential of prospects. Us at BrainyBallers have used RAS religiously in evaluating talents.
To ensure consistency in our data, we focused solely on NFL Draft Combine numbers. We collected RAS data for the top 50 fantasy football PPR (Points Per Reception) finishers since 2003. Throughout this article you will see “bottom 10” which is defined as fantasy football finishers 41-50.
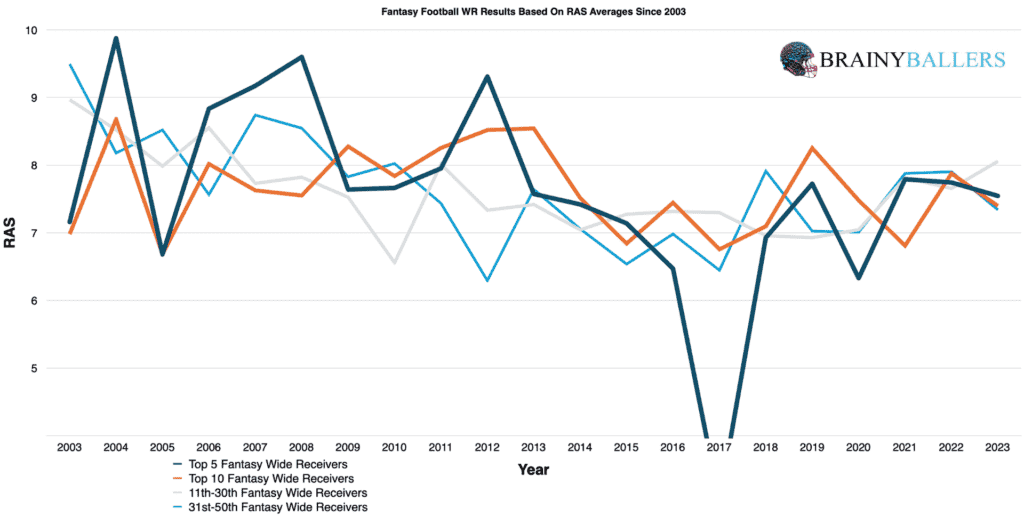
We created an averages chart referencing all WR’s in our data to compare the average of different finisher groups: the top 5, top 10, 11th to 30th, and 31st to 50th finishers every season since 2003. This breakdown aimed to locate any obvious visual trends. However, from this data no trend was found.
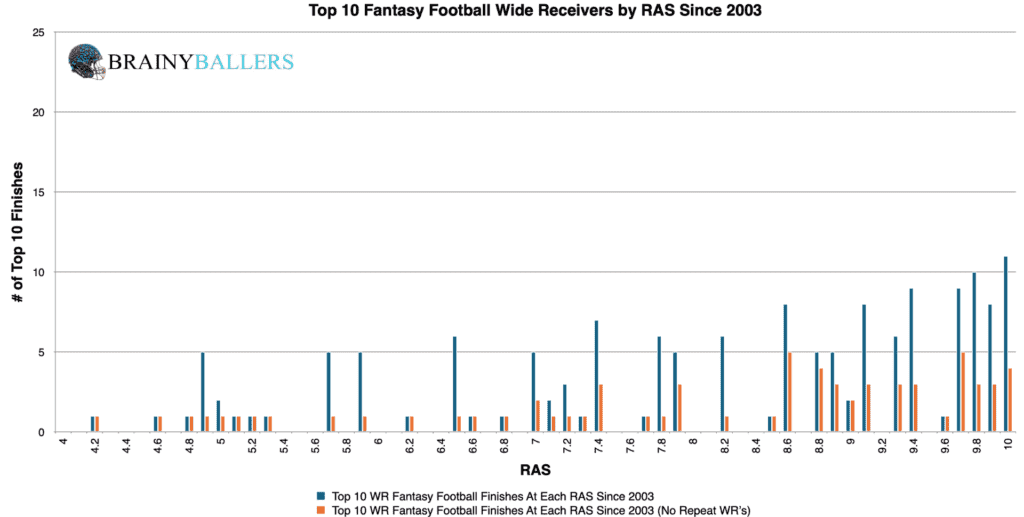
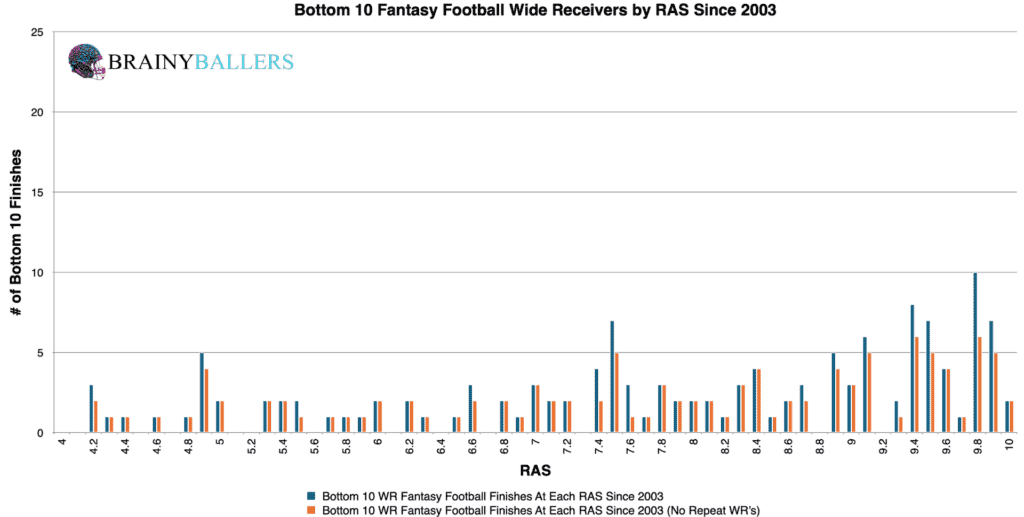
To explore deeper, we charted top 10 finishers in 0.1 RAS increments since 2003. The goal of this was to be able to visually identify where the most top level increases occurred when looking at the top 10 chart and comparing against the bottom 10 chart. From these, you can see that both are more weighted towards higher RAS’s.
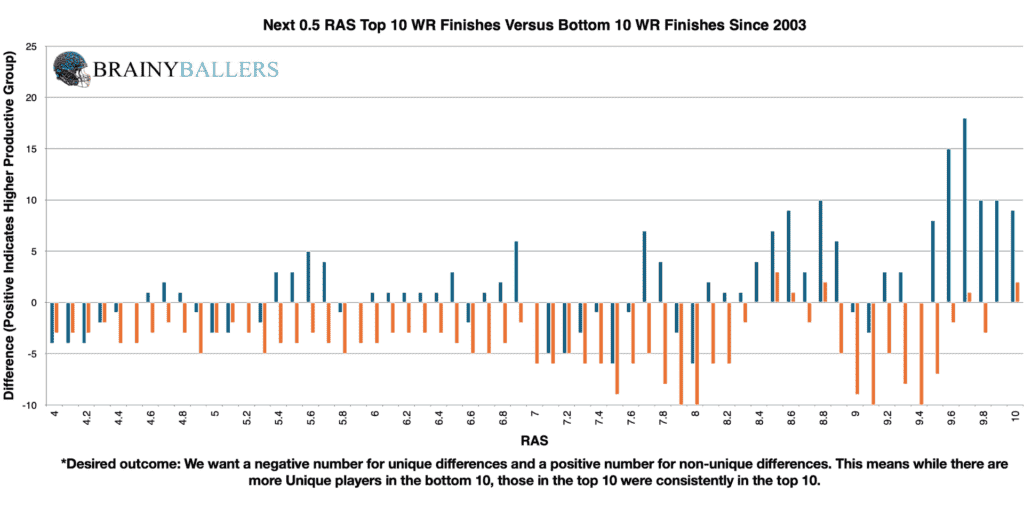
Next, we constructed a differences chart which compares each RAS time, plus the next 0.5 RAS. The purpose of this chart is to find a threshold, or range, where increased consistent top level producers occur. This is done by comparing the top 10 and bottom 10 charts, then including the next 0.5 RAS at each indicated interval. The chart’s desired outcome is a negative number for unique differences (Orange) and a positive number for non-unique differences (Blue). This would indicate the desired consistent top level performances we are hoping for. The results of this chart are just as we expected: top finishers have higher RAS’s at a higher rate than bottom finishers.
We then looked at wide receivers who finished in the bottom 10 from 2003 to 2023. Out of 150 players, 65 had a RAS between 8.4 and 10, accounting for 43.3%. This percentage set the baseline for finding whether this RAS threshold reflected an average wide receiver or a high-performing one. If a higher percentage occurs in the top 10, then we found an average top performing WR.
Since 2003, 83 out of 170 top-10 finishers had a RAS within the 8.4 to 10 range, accounting for 48.8%. This accounts for a 5.5% increased occurrence of this range over the bottom 10.
The differences chart got us close with an eye check. We then adjusted our spreadsheet to find nearby ranges and we found that the 8.5 to 10 RAS range occurred 8.2% more often amongst top-10 finishers than bottom-10 finishers. This range will be the focus of this study going forward.
Due to these findings, RAS could play a factor in our Star-Predictor Score (SPS) model. Since 2.90 is the lowest RAS seen since 2003 in the top 10, that will be the critical value in the SPS. The Star-Predictor Score (SPS) is a scouting tool designed to maximize investment potential and reduce risks when drafting rookies in Fantasy Football. It is proven to have a higher accuracy than draft capital alone to predict fantasy success. The SPS includes 13 to 17 metrics, with the exact number varying by the player’s position. All these metrics are pre-NFL, and some are invented by us, providing a complete analysis of a player’s analytical profiles. The SPS gained widespread notoriety for its high accuracy, having made it on Barstool and The Pat McAfee Show. The SPS can be found here.
After these exciting findings, our regression testing concluded with less excitement. The Pearson value equated to 0.014, well below the 0.1 desired. We are hoping for a minimum of 0.1, or an inverse correlation maximum of -0.1 when we study world-class athletes as we are. For reference to something that everyone acknowledges matters in prospect scouting, and to show the accompanying Pearson value, QB draft capital prevailed a -0.219 Pearson value.
Despite the lack of correlation, we wanted to compare data across different decades in an attempt to catch any emerging trends. We categorized wide receivers into top 10, 11th to 40th, and bottom 10 finishers. This analysis unveiled that the significance of the identified RAS threshold has only slightly increased in the most recent decade.
| 2004-2013 | |||
| Top 10 | 11 through 40 | Bottom 10 | |
| All count | 70 | 228 | 82 |
| Between 8.5 & 10 | 39 | 113 | 39 |
| % (hard zone/all) | 55.7% | 49.6% | 47.6% |
| 2014-2023 | |||
| Top 10 | 11 through 40 | Bottom 10 | |
| All count | 92 | 266 | 89 |
| Between 8.5 & 10 | 41 | 107 | 31 |
| % (hard zone/all) | 44.6% | 40.2% | 34.8% |
What 3 metrics matter the most when scouting a rookie Quarterback? What threshold should Quarterbacks achieve within those metrics to be considered an elite prospect? How much should you value those stats above all other stats? Couldn't answer those questions? Rest easy, we have it handled for you. That's what this chart answers. Sort by importance and/or filter by position. Unlock by signing up with the links provided. $9.99/Year or $24.99 Lifetime access. Cancel anytime.
As made evident by our Pearson Value, RAS prevailed no correlation to fantasy football success. However, if you still wish to believe in this metric, our study found a RAS of 8.5 to 10 as an optimal range for high-level performance. Ultimately, while RAS offers insight into a player’s athletic potential, it is not a definitive predictor of success.
Our series has always sought to push the boundaries of sports analytics. This latest installment reaffirms our commitment to uncovering the hidden dynamics that define the game. Every Saturday, we’ll dive into intriguing questions, bust myths, and settle debates with thorough analysis. We welcome your input. Therefore, please leave comments or reach out with topics you’re eager to see dissected. All of our research can be found on our Analytics Page. Up next on our agenda for Part 63 of “Does It Matter?” is an examination of TE Draft Capital: Does it matter? If so, what’s the BMI threshold necessary for success? Mark your calendars; every Saturday we shed light on the topics that matter to you. All it takes is a quick question being asked and we will go to work for you!


In our 63-part analytical series, “Does It Matter?”, we next wanted to look into the intriguing question of whether a Tight End’s

For our 61 part “Does It Matter?” series, we looked into whether a Wide Receiver’s College Yards After Catch per Reception (YAC/Rec)

In part 60 of our “Does It Matter?” series, we dove into the question of whether a college Wide Receiver’s career Average
