
Can College Yards After Catch Help Predict NFL Success For Wide Receivers?
For our 61 part “Does It Matter?” series, we looked into whether a Wide Receiver’s College Yards After Catch per Reception (YAC/Rec)


In the 5th part of our “Does It Matter?” series, we took a deep dive into NFL statistics to unearth the factors that contribute to a wide receiver’s success. We’re thrilled to share that our number crunching has not only confirmed the significance of weight but also pinpointed two weight ranges to aide in the evaluation of players.
Our journey began by punching in the weight of the top 50 fantasy football wide receivers from 2003 to 2023. To ensure the consistency and reliability of our data, we exclusively utilized NFL draft combine data. We then charted the averages for the top 1, 5, 10, 11-30th, and 31-50th place finishers. That chart can be seen below:
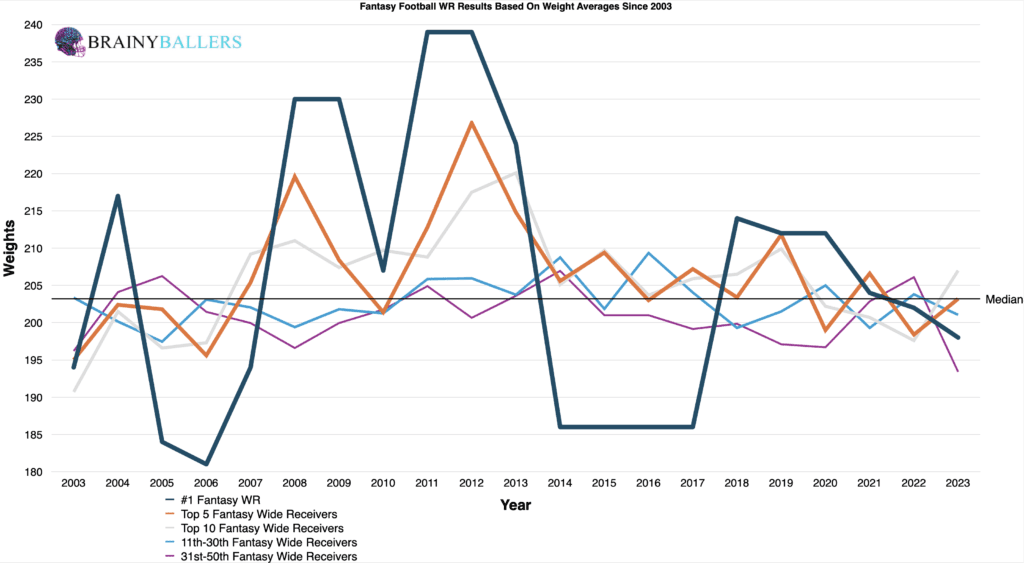
Initial insights from this chart revealed a slight trend: the bulk of higher performers more times than had had a higher weight compared to their lesser performing counterparts. Especially evident in the top 5 and top 10 finishers where they both are at or above the median top 50 finishers for 13/21 (61.9%) of the seasons. Further, the top 5 finishers are at or above the 31-50th place averages finishers 15/21 seasons (71.4%).
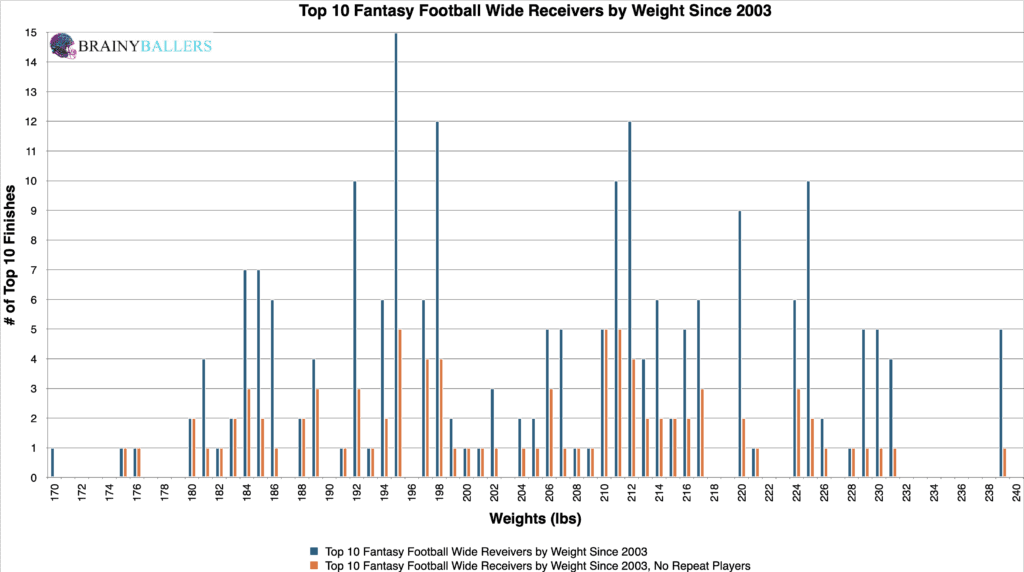
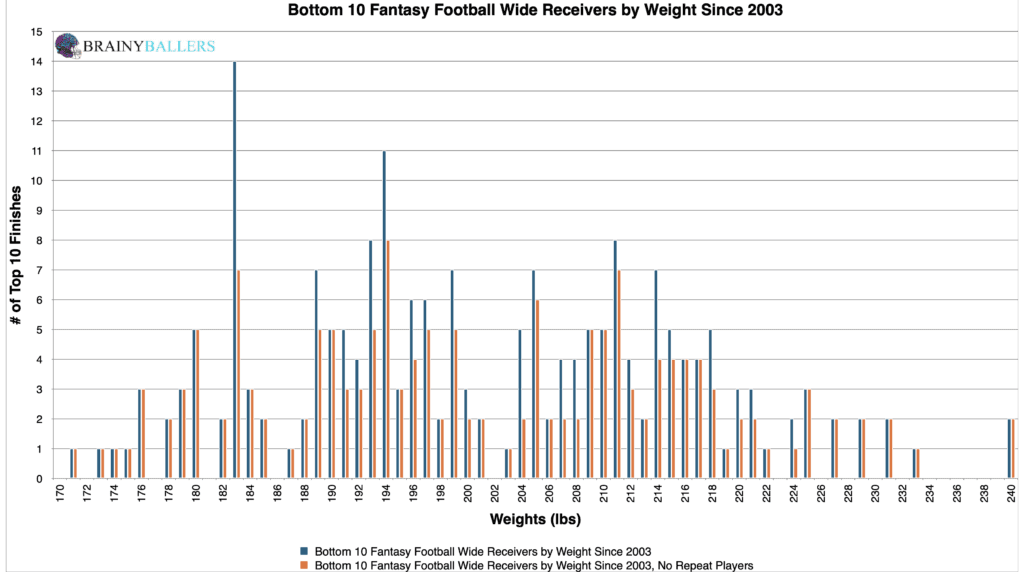
However, we wanted to find more clear trends, so we segmented the top 10 finishers’ weights since 2003 by each pound. A comparative analysis with the lower-tier finishers unveiled striking peaks at specific weights, notably 195 and 198 pounds. The top 10 and Bottom 10 charts can be seen below:
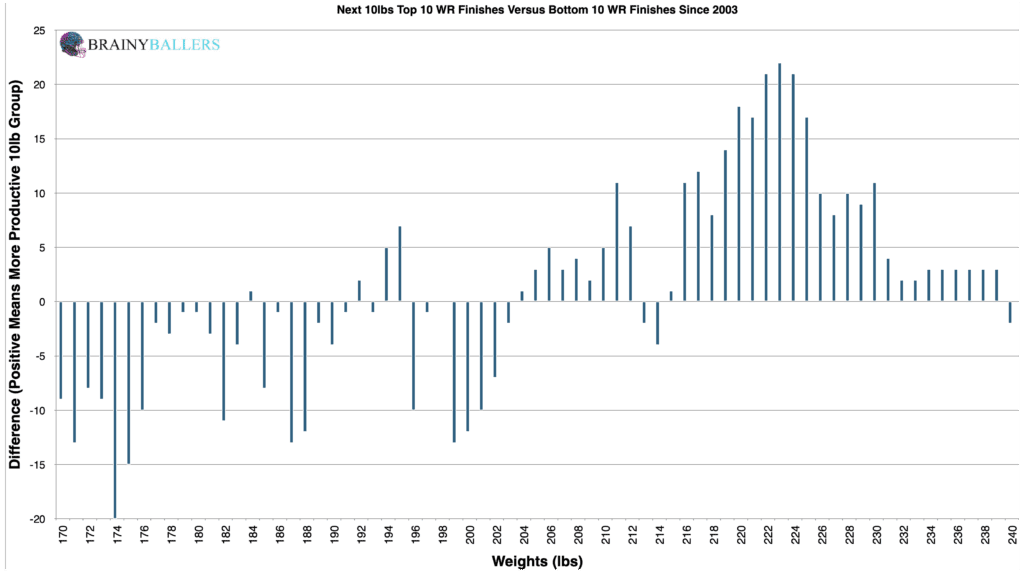
We wanted to pinpoint an applicable weight range that corresponds with peak performance amongst NFL wide receivers. Therefore, we constructed a differential chart comparing the frequency of weights plus the next 10 pounds. Essentially, the top 10 performers against the bottom 10 performers in 10 pound increments beginning at each labeled weight. This examination brought us to a discovery: an optimal range (204-249lbs) where we observed a significant surge in performance metrics.
We now wanted to verify whether this is a typical WR weight, or a typical top performing WR weight. Therefore, we are going to see at what rate this weight occurs in the bottom 10, then compare it back to the top 10, then fine-tune it to verify whether this is the optimal weight or not.
So here the bottom 10 goes: In the bottom 10 since 2003, there were 210 Wide Receivers. Out of this 210, 93 finished within this weight range, which accounts for 44.3%. This sets the baseline for comparison back to the top 10, which you will see next.
If we find a higher percentage in the top 10, then we found the weight of an average top performing WR, not just an average WR. In the top 10, there once again was 210 athletes. From this 210, 114 measured between 204 and 249lbs. This accounts for 54.3%, and a 10.0% increase from the bottom 10 to the top 10! This may be great, but our work won’t stop there. Next, we will attempt to fine-tune this range to verify this as the top performing weight range, or to find a higher producing one.
As mentioned, we next looked to verify this as the optimal WR weight range, or to find a higher producing one. By fine-tuning our spreadsheet numbers, we were able to beat our initial optimal range by finding a higher producing one. This range occurs in the top 10 16.2% more frequently than in the bottom 10. The range is as follows: 210lbs to 239lbs. This optimal range will be the subject of our study going forward.
Due to these findings, weight could play a factor in our Star-Predictor Score (SPS) model. The Star-Predictor Score (SPS) is a scouting tool designed to maximize investment potential and reduce risks when drafting rookies in Fantasy Football. It is proven to have a higher accuracy than draft capital alone to predict fantasy success. The SPS includes 13 to 17 metrics, with the exact number varying by the player’s position. All these metrics are pre-NFL, and some are invented by us, providing a complete analysis of a player’s analytical profiles. The SPS gained widespread notoriety for its high accuracy, having made it on Barstool and The Pat McAfee Show. The SPS can be found here.
Now we turn our attention towards standard statistical methods, namely coefficient values. This is to assess the correlation between WR weights and fantasy points. Here are the weight regression testing numbers:
You can see above that there is a strong correlation between WR weights and fantasy points. These are great findings, and verify the importance of weight when considering Wide Receiver prospects. We are hoping for a minimum of 0.1, or an inverse correlation maximum of -0.1 when we study world-class athletes as we are. For reference to something that everyone acknowledges matters in prospect scouting, and to show the accompanying Pearson value, RB draft capital prevailed a -0.234 Pearson value.
Further, we wanted to compare our data from the most recent decade to two decades ago to reveal time based trends. Those results are seen below:
| 2004-2013 | |||
| Top 10 | 11 through 40 | Bottom 10 | |
| All count | 100 | 300 | 100 |
| Between 210 and 239lbs | 50 | 100 | 31 |
| % (hard zone/all) | 50.0% | 33.3% | 31.0% |
| 2014-2023 | |||
| Top 10 | 11 through 40 | Bottom 10 | |
| All count | 100 | 300 | 100 |
| Between 210 and 239lbs | 47 | 106 | 30 |
| % (hard zone/all) | 47.0% | 35.3% | 30.0% |
From this chart, there are no real trends to be seen. The top 10 to bottom 10 percentage increase remains relatively the same (19.0% and 17.0%, respectively).
What 3 metrics matter the most when scouting a rookie Quarterback? What threshold should Quarterbacks achieve within those metrics to be considered an elite prospect? How much should you value those stats above all other stats? Couldn't answer those questions? Rest easy, we have it handled for you. That's what this chart answers. Sort by importance and/or filter by position. Unlock by signing up with the links provided. $9.99/Year or $24.99 Lifetime access. Cancel anytime.
Our analysis has shown how the 210-239lbs weight range influences the success trajectory of NFL receivers. More than just a number, weight emerges as another tool in fantasy football enthusiasts’ evaluation tool-belt for wide receivers.
Our series has always sought to push the boundaries of sports analytics, and this latest installment reaffirms our commitment to uncovering the hidden dynamics that define the game. Every Saturday We will dive deep into the most intriguing questions, bust myths, and settle debates with thorough analysis similar to this. We thrive on curiosity and welcome your input — so please, leave comments or reach out to us with topics you’re eager to see dissected next. All of our research can be found on our Analytics Page. Up next on our agenda for Part 6 of “Does It Matter?” is an examination of Wide Receiver Hand Size: Does that impact performance? If so, what’s the ideal Hand Size for a WR? Mark your calendars; every Saturday we shed light on the topics that matter to you. All it takes is a short question and we will go to work for you!


For our 61 part “Does It Matter?” series, we looked into whether a Wide Receiver’s College Yards After Catch per Reception (YAC/Rec)

In part 60 of our “Does It Matter?” series, we dove into the question of whether a college Wide Receiver’s career Average

The “Does It Matter?” series, part 59 looked to uncover the role of a quarterback’s rookie touchdown per game (TD/G) in predicting
