Quarterbacks: Can The Star-Predictor Score (SPS) Help Predict NFL Success?
For the 55th part of “Does It Matter?” series, we looked to find out whether the Star-Predictor Score (SPS), found here, is
In part 35 of our “Does It Matter?” series, we looked to answer to the question of when to sell Running Backs throughout their career. To do this, we formulated a calculation to identify when the average career decline began, and identified when the longest career occurred to give us a range of when to sell in terms of AP (All-Purpose) touches. Here are all of our findings.
Utilizing data spanning two decades, we examined the top 50 PPR fantasy football finishers since 2003. The “bottom 10” category, which you will see through this study, is defined as players finishing 41st-50th each season.
Why the top 50?
We analyzed the top 50 fantasy football finishers to find a happy medium between meaningful insights and accurate data. Focusing on only the top 50 avoids skewed results from fringe roster players unlikely to break into the top 10. On the other hand, this range lets us compare the best and worst while relying on data that is far enough away from each other (top 10 versus bottom 10) to spot trends.
Our analysis began by identifying the beginning of career declines for each running back by observing when they failed to return to a -20% performance buffer following their peak season, measured by their AP (All-Purpose) yardage. For example, if they have a career peak (record) season at 1,500 yards, they would need to have at least 1,200 AP Yards the next season for it to not be considered a legitimate decline.
What if the RB steadily declines for less than 20%? Can’t they decline until they have a zero yardage season? Staying in the buffer zone the next season after a peak isn’t considered a decline. However, if consecutively dropping less than 20% over multiple seasons, it is once they drop out of the peak AP Yardage season buffer zone that is considered a decline. This is to prevent RB’s from continuously extending buffer zones indefinitely to avoid ever recognizing a decline.
What if they drop from 3,000 AP Yardage to 2,000 AP Yardage? They are still producing at a high level… A RB must be under 1,400 AP Yards and meet all the other prerequisites we just detailed in order to be considered a decline. In other words, a RB can drop from 2,100 AP Yards to 1,401 Yards the next season and not have that considered a decline, since 1,400 yards is still a great performance. My personal goal of this was to find when a decline occurs PAST a point where they are not worth starting on my fantasy teams.
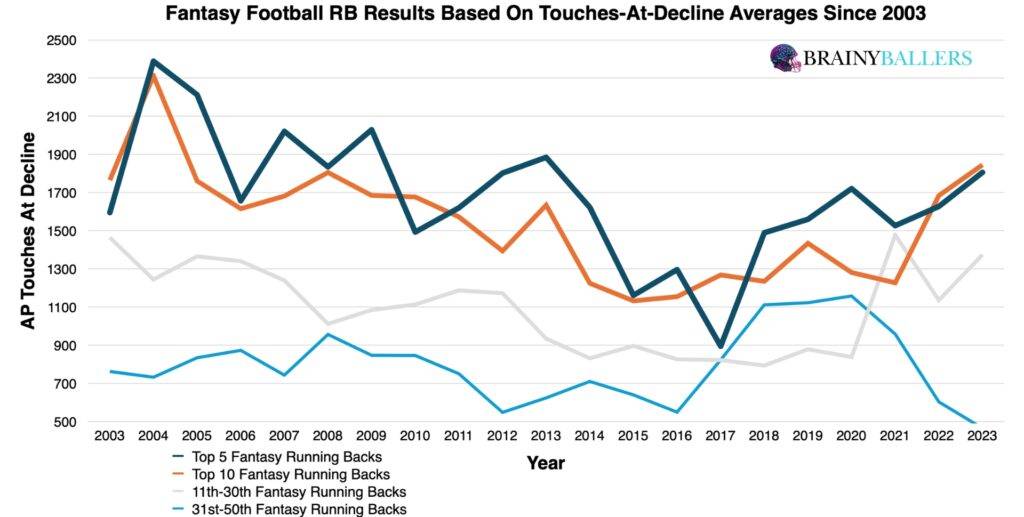
To begin our study, we produced an averages chart that categorized finishers into four groups: top 5, top 10, 11th-30th, and 31st-50th place. From this, 21 out of 21 seasons since 2003 showed that the top 10 finishers consistently recorded higher career AP Touches at decline commencement compared to those finishing 31st-50th. This finding, while seemingly obvious, shows the following observation: good production on the field correlates with longer careers. As far as the numbers you will see within here, each AP Touches value is at the peak, before the decline began.
Diving deeper, we segmented the top 10 finishers since 2003 into 100 peak AP Touch increments. This analysis revealed a clear pattern: those in the top 10 were more heavily weighted towards higher career AP Touch decline commencements compared to their lesser counterparts. This analysis once again highlights the significance of initial career success and its correlation with longer career AP Touches longevity.
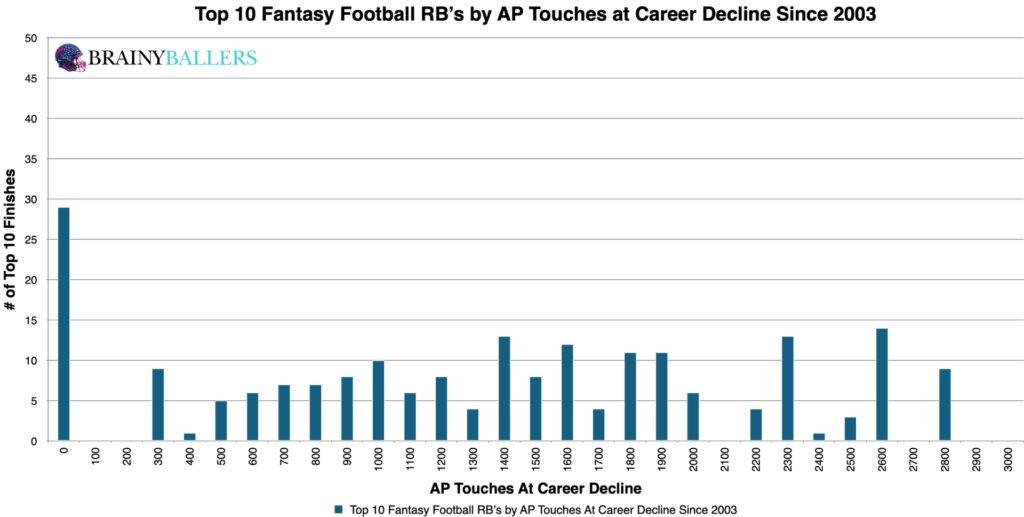
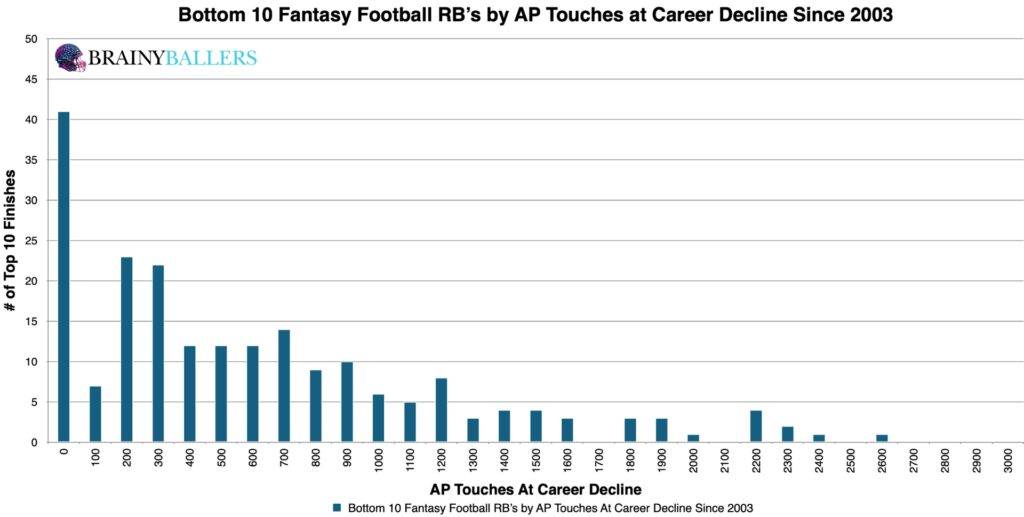
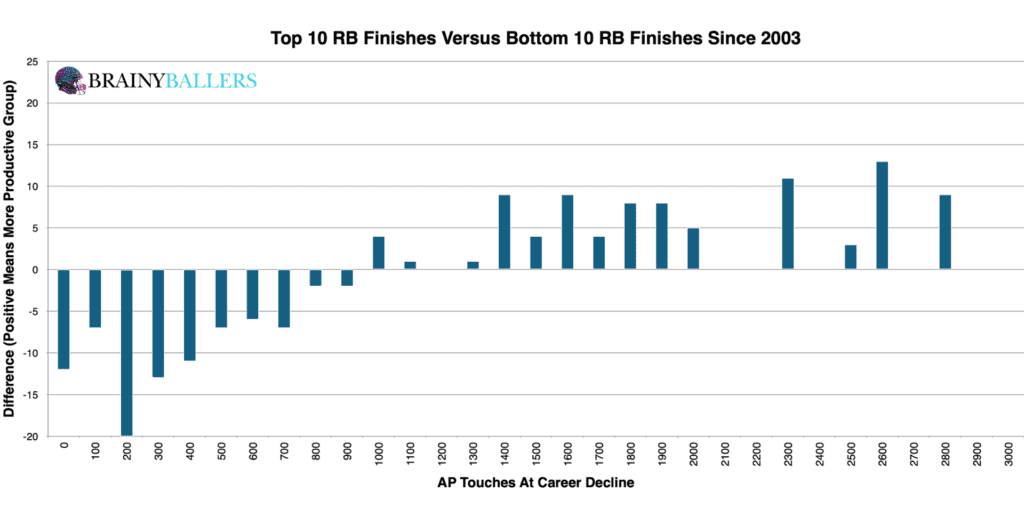
Our aim was to find the threshold at which top 10 Running Backs produced more career AP Touches before their decline began when compared to the bottom 10. This led us to develop our differences chart for this, which will become the backbone of this analysis.
As you can see from the chart, it is evident that transitioning past 1,000 All-Purpose Touches marked a distinct shift—from being within the bottom 10 to rising into the top 10 performers. Essentially, if you reach 1,000 career AP Touches but have not had a top 10 PPR season yet, you have more than likely already peaked. For those who have reached top 10 PPR early in their careers, they more than likely have a minimum of 1,000 career AP Touches. That chart can be seen below:
We next wanted to see how different the rate appearance is of being above 1,000 career AP Touches at career declines in the top 10 finishers versus the bottom 10. For the bottom 10, out of 210 RBs evaluated, 48 players fell within the identified range, accounting for 22.9% of the total. This percentage established a baseline to compare against the top 10 finishers to determine whether 1,000 AP Touches is actually indicative of an average, or top-performing, RB.
When we looked at the top 10 finishes from 2003 to 2023, an obvious pattern emerged. Out of 210 top 10 finishers, 137 RBs reached the 1,000 AP Touches at career decline threshold — accounting for an impressive 65.2%. This represented a significant 42.4% increase from the bottom 10 baseline.
This leap shows once again that if you are successful, you more than likely will continue past the 1,000 career AP Touches threshold.
Understanding when a player has reached the peak career duration is critical as well. Therefore, Our study focused on segmenting the top 50 PPR finishers since 2003 into smaller groups: top 10, 20, 30, 40, and 50. We looked to find the longest careers within each threshold. That breakdown can be seen below, excluding a large outlier with 3,758 AP Touches:
With this breakdown, we realized that 2,823 AP Touches serves as a vital threshold for running backs. If you ever have a player beyond this point, it is time to sell, or expect them to expire worthless on your roster any given second.
Using standard statistical methods, our findings revealed a significant correlation between an RB’s AP Touches at career decline and fantasy production. That breakdown can be seen below:
With these, there is a substantial and significant relationship. We are hoping for a minimum of 0.1, or an inverse correlation maximum of -0.1 while studying world-class athletes as we are. This once again confirms that players who produce more, experience longer careers typically. For reference to something that everyone acknowledges matters in prospect scouting, and to show the accompanying Pearson value, RB draft capital prevailed a -0.234 Pearson value.
To sum it up: when a RB enters the league, it’s a race to finish top 10 PPR before their 1,000th career AP Touch. If they don’t, they are instant sells, as the clock has more than likely ran out for them. If they do, the average top 10 RB begins their decline at their 1,320th AP Touch and no later than 2,823. I’m personally selling around the 1,600 AP Touch mark, roughly one season after the average mark. You can adjust within those numbers due to what you are willing to risk. Also, finding top 10 PPR backs before they reach their 1,320th career AP touch could prevail profits, as they probably haven’t peaked quite yet.
Using these insights, we found notable RBs who should potentially be traded away, or at least monitored closely.
Exceeding 1,000 AP Touches Without a Top 10 PPR Season (Sell ASAP):
Approaching 1,000 AP Touches Without a Top 10 PPR Season (monitor):
Big names past the average and/or near the 2,823 AP Touches Critical Decline Threshold:
This detailed study supports the theory that top performers typically enjoy longer careers. As far as when to sell Running Backs, the 1,000 AP Touches mark revealed a vital insight into how the remainder of a RB’s career will pan out. When to sell Running Backs who have a history of performing within the top 10 of PPR Leaderboards requires a bit more patience, but don’t hold them until they get close to 2,823 AP Touches, like Derrick Henry currently is.
Our series has always sought to push the boundaries of sports analytics. This latest installment reaffirms our commitment to uncovering the hidden dynamics that define the game. Every Saturday, we’ll dive into intriguing questions, bust myths, and settle debates with thorough analysis. We welcome your input. Therefore, please leave comments or reach out with topics you’re eager to see dissected. Premium Analytics subscribers get priority. All of our research can be found on our Analytics Page. Up next on our agenda for Part 36 of “Does It Matter?” will be an examination of Linebacker Height: Does it matter? If so, what’s the Height threshold necessary for NFL success? Mark your calendars; every Saturday we shed light on the topics that matter to you.
What metric matters the most when scouting a rookie Running Back? What threshold should Running Backs achieve within that metric to be considered an elite prospect? How much should you value that stat above all other stats? Couldn't answer those questions? Rest easy, we have it handled for you. That's what this chart answers. Sort by importance and/or filter by position. Unlock by signing up with the links provided. $9.99/Year or $24.99 Lifetime access. Cancel anytime.
BrainyBallers Buy-Hold-Sell Chart (All Players)
Get Your Order 100% Refunded By Predicting The Next SuperBowl Winner!
Make Money on BrainyBallers’ (Or anyone’s) content if it turns out to be incorrect!

For the 55th part of “Does It Matter?” series, we looked to find out whether the Star-Predictor Score (SPS), found here, is
For the next entry into our now 54-part “Does It Matter?” series, we assessed whether the Tight Ends Star-Predictor Score (SPS), found
For the 53rd entry in our “Does It Matter?” series, we explore how effectively the Running Back Star-Predictor Score (SPS), found here,