
Can Draft Capital Help Predict Tight End Success?
In our 63-part analytical series, “Does It Matter?”, we next wanted to look into the intriguing question of whether a Tight End’s


Welcome to Part 20 of our “Does It Matter?” series, where we look at popular sports theories to separate fact from fiction and find optimal ranges for things such as heights or hand sizes. Today, we dive into the Wide Receiver 525 rookie yards theory. This theory suggests that rookie wide receivers who achieve 525 yards in their first NFL season have a higher probability of career success. Is that fact, or a theory not justified to continue believing in? We will find out here.
This article will be a 4-step process, following these steps:
What you will see in here is that 525 yards is not enough to predict future success. We define what the real threshold should be within this article. Further, we break down the 2023 rookies to buy using our reference guide. Here are all of our findings:
To find the true high-performing threshold for WRs, we looked at the top 50 fantasy football finishers since 2003. To maintain consistency, we utilized only PPR fantasy scores. Throughout this study, you will see the “bottom 10” term, which is defined as PPR finishers 41st-50th every season. Using polls we ran, we define a “success” as a WR who has 2-1,000 receiving yard seasons in their career. To find the rookie yardage threshold that shows up in the top 10 PPR finishers the most, we looked at data from 2003-2023. The data timeframe we looked at to apply the 525 yard threshold theory and our threshold was 2000 to 2021.
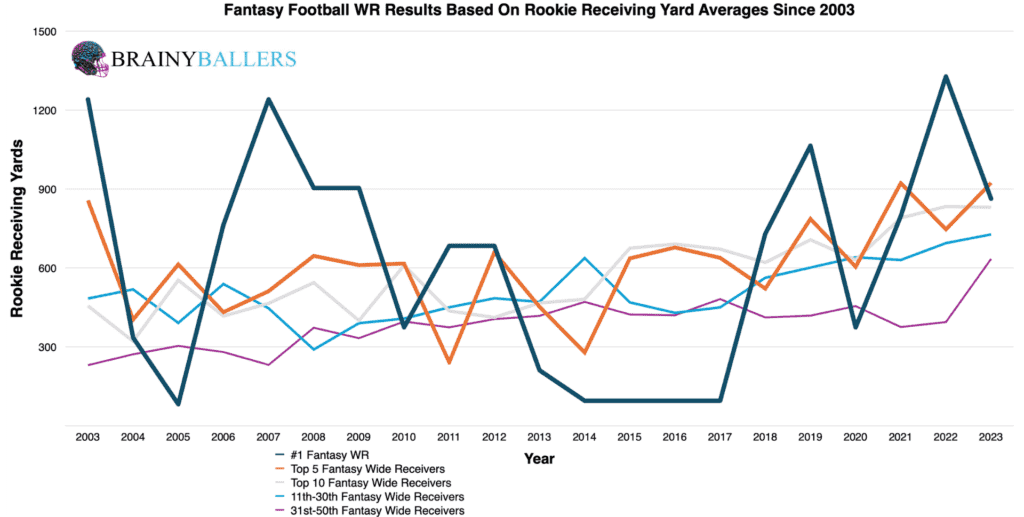
To begin our search of finding the rookie yardage threshold that shows up in the top 10 PPR finishers the most, we mapped out averages for the top 5, top 10, 11th-30th, and 31st-50th place finishers every season since 2003. From this, it was hard to decipher whether higher rookie yardage totals correlate to higher future successes or not.
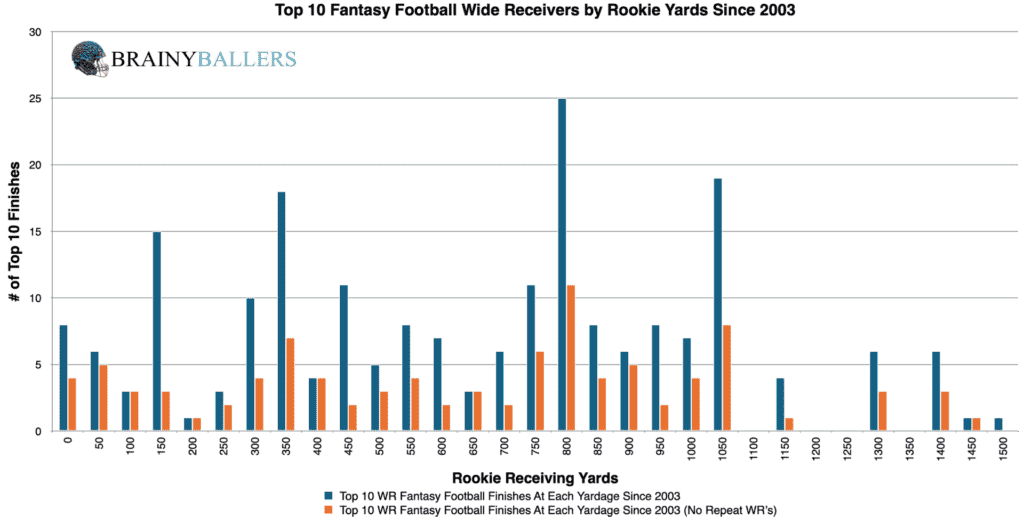
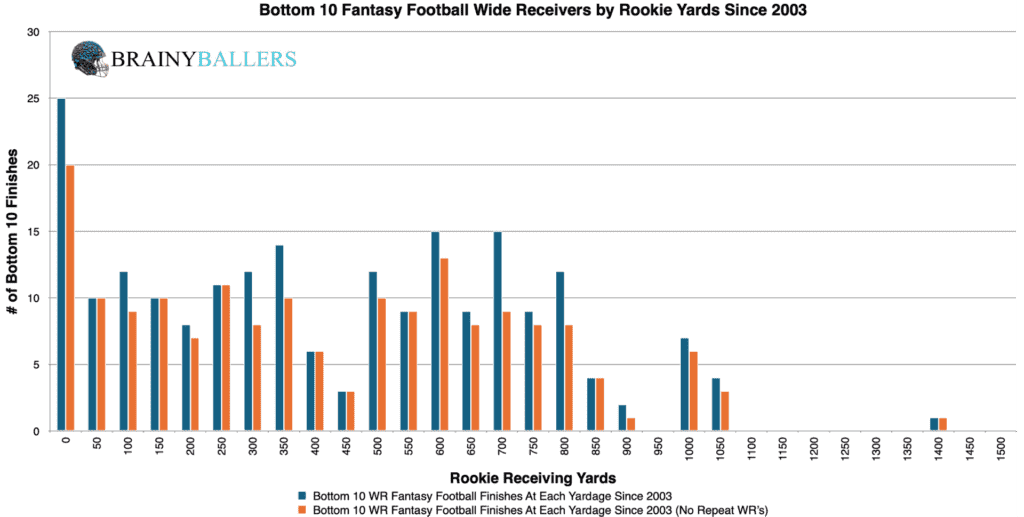
Next, we segmented top and bottom 10 finishers into 50-yard rookie season increments. This segmentation revealed the trend we were expecting: higher rookie yardages showed up more often in top 10 finishes than in the bottom 10. These charts can be seen below, with the top 10 first:
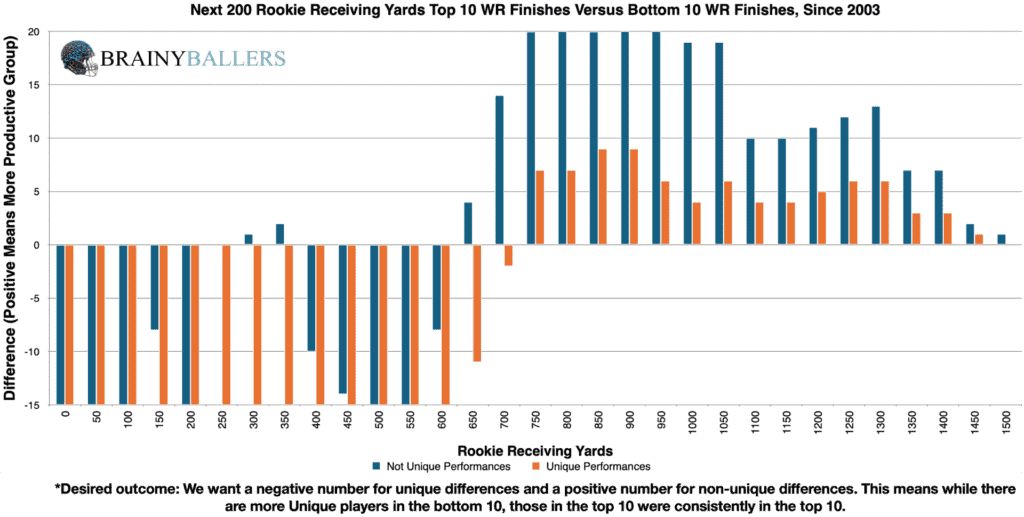
With our goal of identifying a threshold of rookie yardage that correlates to higher future success, we created a differences chart. This chart compares yardages over a 200-yard range. Essentially, we subtracted the bottom 10 results from the top 10 results and did this for each 200 yard range beginning at the indicated yardage value. The chart’s desired outcome is a negative number for unique differences (Orange) and a positive number for non-unique differences (Blue). This would indicate the desired consistent top level performances we are hoping for. This analysis revealed that a yardage of 700 yards is the starting point for a significant performance increase. This guided us closer to a meaningful threshold which correlates to more frequent elite performances.
Now our attention turns to examining the 700-yard threshold by looking at rookie WRs who finished in the bottom 10. Our data set included 210 WRs. Out of these, 54 had at least 700 yards, translating to 25.7%. This percentage served as the baseline for our comparative analysis with top 10 finishers. This will help us determine if 700 yards represents an average WR’s rookie yardage threshold, or if we have an average top-performing WR’s rookie yardage threshold.
Our analysis now looked at the top 10 finishers between 2003 and 2023. Of the 210 WRs in this group, 108 surpassed the 700-yard threshold, which is 51.4%. This indicated a significant 25.7% increase compared to the bottom 10 finishers. Therefore, it’s evident that surpassing 700 yards in rookie seasons is an indicator of a top-performing WR. Although this is great, our dive into finding the highest producing threshold didn’t stop there:
To solidify our findings, we upgraded our spreadsheet to allow for quick range adjustments and more accurate identification of the highest producing range. Upon testing all close numbers to 700, we discovered that adjusting the threshold 1 yard to 701 yards and above resulted in a 30.0% higher occurrence in the top 10 compared to the bottom 10. When looking at the 525 yard threshold, there is only an 18.6% higher occurrence in the top 10 compared to the bottom 10. Therefore, 701 yards and above is established as our benchmark for attempting to predict future top performances. This threshold will be the subject of this research going forward.
Due to these findings, BMI could play a significant factor in our Post-Rookie Star-Predictor Score (SPS) model. Since 0 yards is the lowest seen since 2003 in the top 5, there will be no critical value for the Post-Rookie SPS in regards to rookie yardages. The Star-Predictor Score (SPS) is a scouting tool designed to maximize investment potential and reduce risks when drafting rookies in Fantasy Football. It is proven to have a higher accuracy than draft capital alone to predict fantasy success. The SPS includes 13 to 17 metrics, with the exact number varying by the player’s position. All these metrics are pre-NFL, and some are invented by us, providing a complete analysis of a player’s analytical profiles. The SPS gained widespread notoriety for its high accuracy, having made it on Barstool and The Pat McAfee Show. The SPS can be found here.
We next wanted to use standard statistical methods to see if there is a correlation between WR rookie yardage totals and fantasy production. Here are the findings:
This relationship highlights a strong correlation between rookie yardage totals and future fantasy production. We are hoping for a minimum of 0.1, or an inverse correlation maximum of -0.1 when we study world-class athletes as we are. For reference to something that everyone acknowledges matters in prospect scouting, and to show the accompanying Pearson value, RB draft capital prevailed a -0.234 Pearson value.
Now that we have identified the range we should be hoping for in rookie WR’s, we are now going to see what the success rate is of Wide Receivers who finished above 701 yards in their rookie season. For this, we ran polls to attempt to find a consensus on what the definition of a “success” is. From this, we found that 2-1,000 yard seasons in a career is the definition of a Wide Receiver success. Therefore, if a Wide Receiver finishes above 701 yards in their rookie season and they have 2 seasons with at least 1,000 yards, that is an example of our threshold being a successful predictor. The same goes for the 525 yard threshold theory, which we will compare both success rates to see which one is a stronger predictor. Further, we are using rookie data since 2000.
So here it goes: Since the year 2000, there were 31 Wide Receivers with at least 701 yards. 21 of those Wide Receivers went on to have successful careers. This accounts for a 66.7% future success probability.
Similar to our Top 10 to Bottom 10 comparison you seen earlier, we are now going to compare the 701 yards success predictor rate to the 525 threshold success rate. So here are those numbers: Out of 44 Wide Receivers who finished their rookie season at or above 525 yards, 24 went on to have successful careers. This accounts for 54.5%. Essentially, it is still a coin-flip if a Wide Receiver finishes at, or above, 525 yards in their rookie season whether they will have a successful career or not.
Due to a strong Top 10 to Bottom 10 increased rate, and strong regression testing support with using rookie season yardage as a predictor, we are recommending using the established threshold of 701 yards and above for better accuracy in predicting future WR career success. No longer should 525 yards be used as the predictive threshold.
These rates were of NFL Draft 1st round rookies, as the 525 yard theory initially was in reference to. If we went down to the rates of players drafted in all rounds, the numbers are even more convincing. Accounting for all rounds, 43% of players with at least 525 yards in their rookie seasons went on to have successful careers. Less than a coin-flip, while our 701 yard threshold prevailed a 63% success probability.
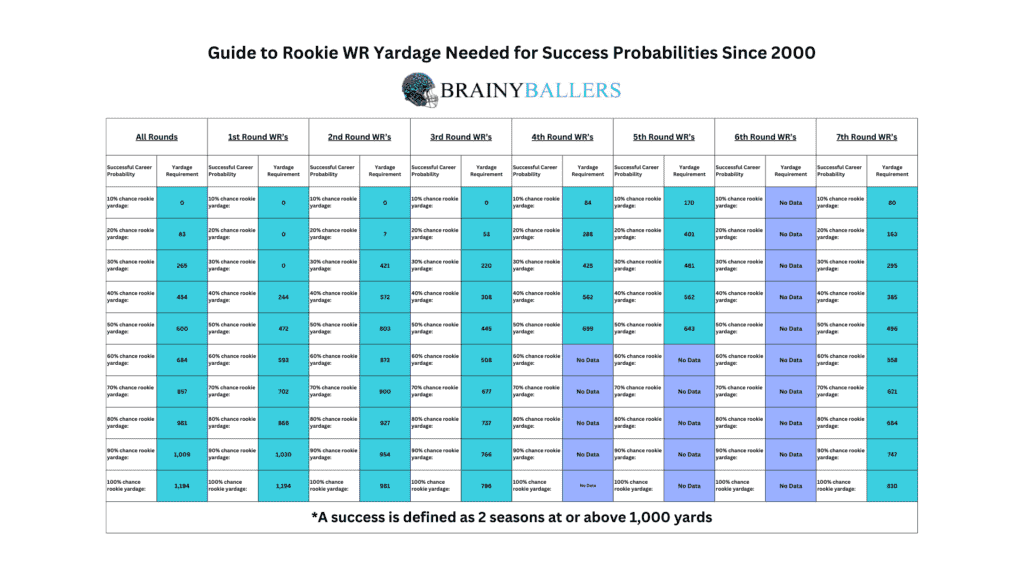
Now comes possibly the most fun part out of all of this: a guide for referencing to each player on a yearly basis and to see what rookie yardage prevails to different success probabilities, such as 100%. This could be used to find sleepers who have a high probability of future success, but are being slept on due to different factors. Further, we broke it down into each NFL Draft round so you can (on an extremely specific basis) reference how each rookie’s future success probability is shaping out mid-season. Seen below is that graphic. We are hoping everyone saves this for reference and shares (with non-league mates, of course, so you can keep a competitive edge). This article may become exclusive to our members only, so save it while you can!
Next, we wanted to compare our optimal rookie yardage threshold within the last two decades to find whether this is an emerging trend or the opposite. As you can see below, this analysis revealed a 12.5% increase in the occurrence of our optimal threshold in top 10 performers when compared to bottom 10 in the most recent decade, signifying the threshold’s increasing importance.
| 2004-2013 | |||
| Top 10 | 11 through 40 | Bottom 10 | |
| All count | 100 | 300 | 130 |
| All Above 701 | 41 | 100 | 24 |
| % (hard zone/all) | 41.0% | 33.3% | 18.5% |
| 2014-2023 | |||
| Top 10 | 11 through 40 | Bottom 10 | |
| All count | 100 | 300 | 100 |
| All Above 701 | 57 | 122 | 22 |
| % (hard zone/all) | 57.0% | 40.7% | 22.0% |
What 3 metrics matter the most when scouting a rookie Quarterback? What threshold should Quarterbacks achieve within those metrics to be considered an elite prospect? How much should you value those stats above all other stats? Couldn't answer those questions? Rest easy, we have it handled for you. That's what this chart answers. Sort by importance and/or filter by position. Unlock by signing up with the links provided. $9.99/Year or $24.99 Lifetime access. Cancel anytime.
Our number crunching revealed that the rookie Wide Receiver 525 yards theory is still a coin-flip to being used as a success predictor. For a more significant prediction of career success, the 701-yard threshold should be used. By creating a differences chart and conducting regression testing, we established that 701 yards is a solid predictor of future top-performing Wide Receivers. What this essentially means is not a full debunk of the 525 yard theory, but an adjustment of expectations – a changing of the goalposts. By using our graphical guide, you can better follow the potential career trajectory of your favorite rookie WRs, and make better decisions on who to trade for or who to draft.
Our series has always sought to push the boundaries of sports analytics. This latest installment reaffirms our commitment to uncovering the hidden dynamics that define the game. Every Saturday, we’ll dive into intriguing questions, bust myths, and settle debates with thorough analysis. We welcome your input. Therefore, please leave comments or reach out with topics you’re eager to see dissected. Premium Analytics subscribers get priority. All of our research can be found on our Analytics Page. Up next on our agenda for Part 21 of “Does It Matter?” is an examination of TE Height: Does it matter? If so, what’s the Height threshold necessary for TE success? Mark your calendars; every Saturday we shed light on the topics that matter to you. If you’re a Premium Analytics subscriber, all it takes is a quick question being asked and we will go to work for you!


In our 63-part analytical series, “Does It Matter?”, we next wanted to look into the intriguing question of whether a Tight End’s

For our 61 part “Does It Matter?” series, we looked into whether a Wide Receiver’s College Yards After Catch per Reception (YAC/Rec)

In part 60 of our “Does It Matter?” series, we dove into the question of whether a college Wide Receiver’s career Average
