
Can Draft Capital Help Predict Tight End Success?
In our 63-part analytical series, “Does It Matter?”, we next wanted to look into the intriguing question of whether a Tight End’s


For part 37 of our “Does It Matter?” series, we dove into the potential correlation between a wide receiver’s best college yardage season and their success in the NFL. Using statistical analysis, we hoped to determine if there’s a pattern that could lead us to value specific players over others for fantasy football purposes. Here are all our findings:
To explore this potential trend, we examined the top 50 fantasy football finishers in the PPR format from 2003 onward. Our primary focus was the wide receivers’ best yardage seasons from their college careers using All-Purpose Yardages, which we theorized might show top-end potential, and could serve as a predictive measure of future NFL success. Throughout this study, you will see the term “bottom 10,” which is defined as those finishing 41st-50th each season since 2003.
Why the top 50? We chose the top 50 to maintain a “happy medium”. Going further than that will have players who are fringe roster players and therefore could just skew our data. On the other hand, we wanted to compare the best to the worst without including the 11th place finisher to compare to the top 10, or a finisher anywhere close to the top 10.
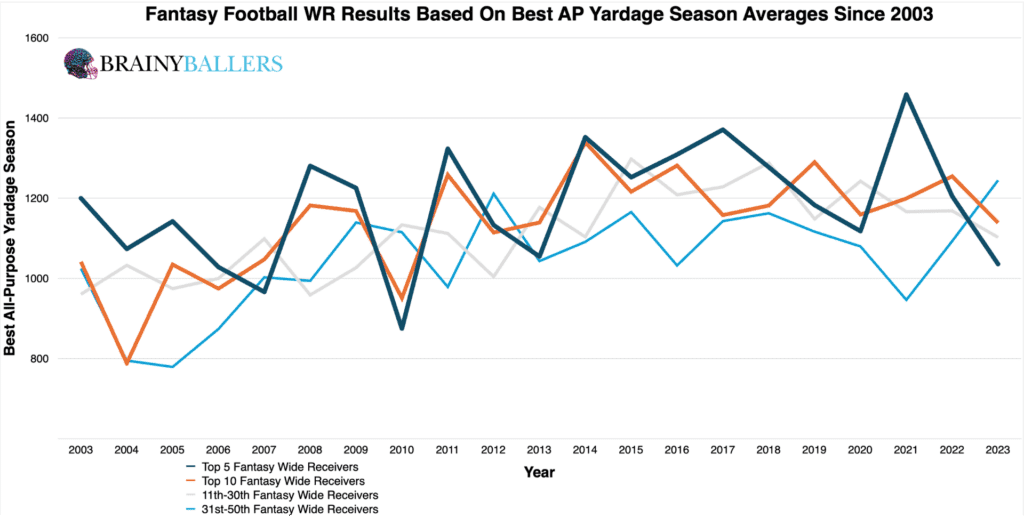
Our averages chart revealed an intriguing pattern: In 16 out of 21 seasons (76.2%), players who finished in the top 5 had better top AP yardage seasons during their college career compared to those who finished 31st-50th. This trend hints at a likely correlation between higher college AP yardage seasons and elite NFL performances.
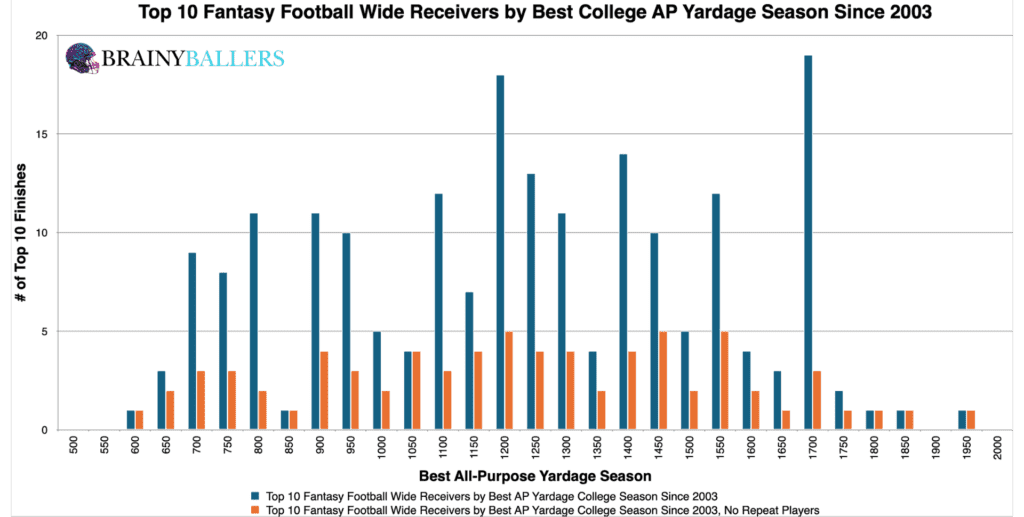
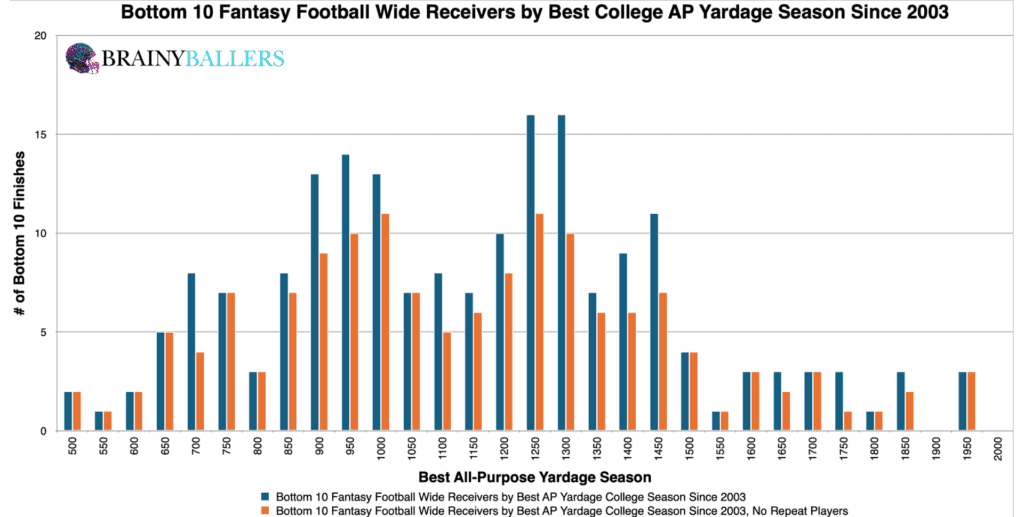
Further, we plotted the top and bottom 10 finishers’ yards into 50-yard increments. This showed a heavier weight for higher best college AP yardage seasons amongst the top 10 more than the bottom 10, as you can see below:
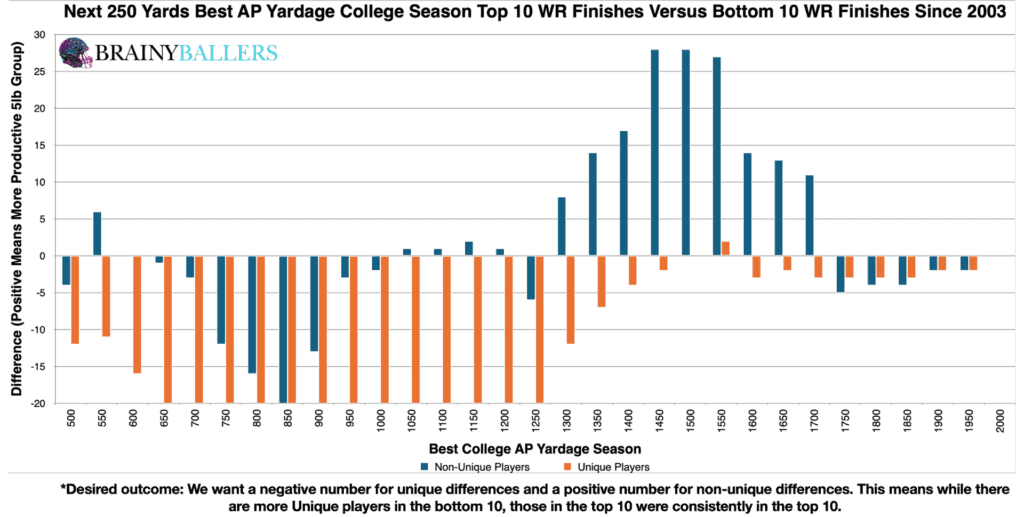
To find an optimal and applicable threshold, we constructed a differences chart. This chart compared each best AP College yardage season, along with the next 250-yard increments, subtracting bottom 10 results from top 10 results. The chart’s desired outcome is a negative number for unique differences (Orange) and a positive number for non-unique differences (Blue). This would indicate the desired consistent top level performances we are hoping for. Our initial findings suggested that 1,300 AP Yards and above signaled a top-performing threshold. However, we wanted to verify or debunk this threshold, which we will do next.
Using our spreadsheet, we made range adjustments to attempt to find the actual top producing threshold. By crunching numbers around the identified range, we discovered that adjusting the threshold to 1,100 AP Yards and above resulted in a 13.8% higher appearance rate in the top 10 compared to the bottom 10. To explain this clearly, what this is saying is as follows: if you finish one college season with 1,076 (before rounding) or more AP Yardage and have a role on an NFL roster, you are more likely to finish top 10 PPR at least once in your career than not. This threshold will be the subject of this study going forward, and will be our optimal range for this metric.
Due to these findings, WR top college yardage seasons could play a factor in our Star-Predictor Score (SPS) model. Since 200 yards is the lowest seen since 2003 in the top 10, this will be the critical value for the SPS. The Star-Predictor Score (SPS) is a scouting tool designed to maximize investment potential and reduce risks when drafting rookies in Fantasy Football. It is proven to have a higher accuracy than draft capital alone to predict fantasy success. The SPS includes 13 to 17 metrics, with the exact number varying by the player’s position. All these metrics are pre-NFL, and some are invented by us, providing a complete analysis of a player’s analytical profiles. The SPS gained widespread notoriety for its high accuracy, having made it on Barstool and The Pat McAfee Show. The SPS can be found here.
Employing standard statistical methods, we calculated a Pearson Value of 0.138. This shows a strong correlation between a wide receiver’s best AP college yardage season and fantasy production. We are hoping for a minimum of 0.1, or an inverse correlation maximum of -0.1 when we study world-class athletes as we are. For reference to something that everyone acknowledges matters in prospect scouting, and to show the accompanying Pearson value, QB draft capital prevailed a -0.219 Pearson value.
Next, we examined our optimal range across different decades. This revealed how significant this best AP college yardage season range is for top 10, 11th-40th, and bottom 10 finishers. This showed the following trend: the significance of our optimal range remained a steady predictor across the last two decades.
| 2004-2013 | |||
| Top 10 | 11 through 40 | Bottom 10 | |
| All count | 92 | 282 | 95 |
| All 1,100 and above | 58 | 148 | 46 |
| % (Optimal Range/all) | 63.0% | 52.5% | 48.4% |
| 2014-2023 | |||
| Top 10 | 11 through 40 | Bottom 10 | |
| All count | 100 | 299 | 97 |
| All 1,100 and above | 75 | 205 | 59 |
| % (Optimal Range/all) | 75.0% | 68.6% | 60.8% |
What 3 metrics matter the most when scouting a rookie Quarterback? What threshold should Quarterbacks achieve within those metrics to be considered an elite prospect? How much should you value those stats above all other stats? Couldn't answer those questions? Rest easy, we have it handled for you. That's what this chart answers. Sort by importance and/or filter by position. Unlock by signing up with the links provided. $9.99/Year or $24.99 Lifetime access. Cancel anytime.
The decadal differences chart indicated that the discovered optimal range, particularly 1,100 AP Yards and above, consistently led to top performances more than bottom performances. Further, we had statistical support to back up our theory that a WR’s best AP yardage season can predict NFL success. Look for players at or above 1,076 AP Yards for a boost in their NFL potential. If they finish at least one college season with 1,076 AP Yards or higher and if they have a role on an NFL team, they are more than likely to finish top 10 PPR than not at least once.
Our series has always sought to push the boundaries of sports analytics. This latest installment reaffirms our commitment to uncovering the hidden dynamics that define the game. Every Saturday, we’ll dive into intriguing questions, bust myths, and settle debates with thorough analysis. We welcome your input. Therefore, please leave comments or reach out with topics you’re eager to see dissected. All of our research can be found on our Analytics Page. Up next on our agenda for Part 38 of “Does It Matter?” is an examination of Defensive End Height: Does it matter? If so, what’s the height threshold necessary for NFL success? Mark your calendars; every Saturday we shed light on the topics that matter to you. All it takes is a quick question being asked and we will go to work for you!


BrainyBallers Buy-Hold-Sell Chart (All Players)
Get Your Products 100% Refunded By Predicting The Next SuperBowl Winner!
In our 63-part analytical series, “Does It Matter?”, we next wanted to look into the intriguing question of whether a Tight End’s

For our 61 part “Does It Matter?” series, we looked into whether a Wide Receiver’s College Yards After Catch per Reception (YAC/Rec)

In part 60 of our “Does It Matter?” series, we dove into the question of whether a college Wide Receiver’s career Average
