
Can College Yards After Catch Help Predict NFL Success For Wide Receivers?
For our 61 part “Does It Matter?” series, we looked into whether a Wide Receiver’s College Yards After Catch per Reception (YAC/Rec)


For part 18 of our “Does It Matter?” series, we looked to determine whether 3-Cone drill times can predict WR success in the NFL. To achieve this, we analyzed data since 2003 in an attempt to find exactly what threshold, or range, occurs more frequently amongst top producers than the bottom producers of the NFL. Here is everything we’ve found:
For consistency, we stuck to NFL Combine 3-Cone times of the top 50 PPR fantasy football finishers since 2003. Throughout this study, you will see the “bottom 10” term, which is defined as PPR finishers 41st-50th every season.
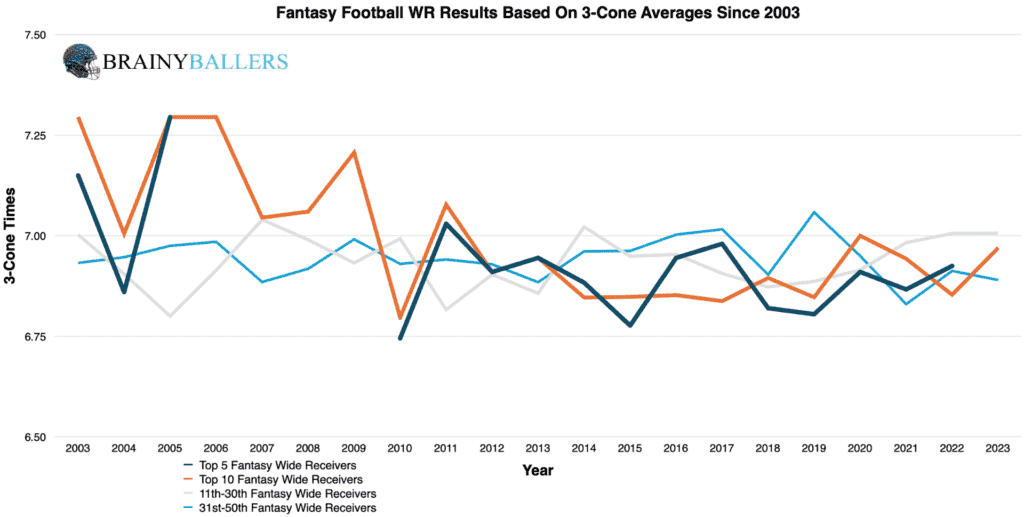
To begin our study, we constructed an averages chart and broke it down into top 5, top 10, 11th-30th, and 31st-50th place finishers. This chart revealed some interesting patterns: Top 5 finishers averaged lower 3-Cone times than the 31st-50th place finishers in 10 of the 12 years with available data for the top 5. This supports the hypothesis that quicker 3-Cone times correlate with better fantasy performances.
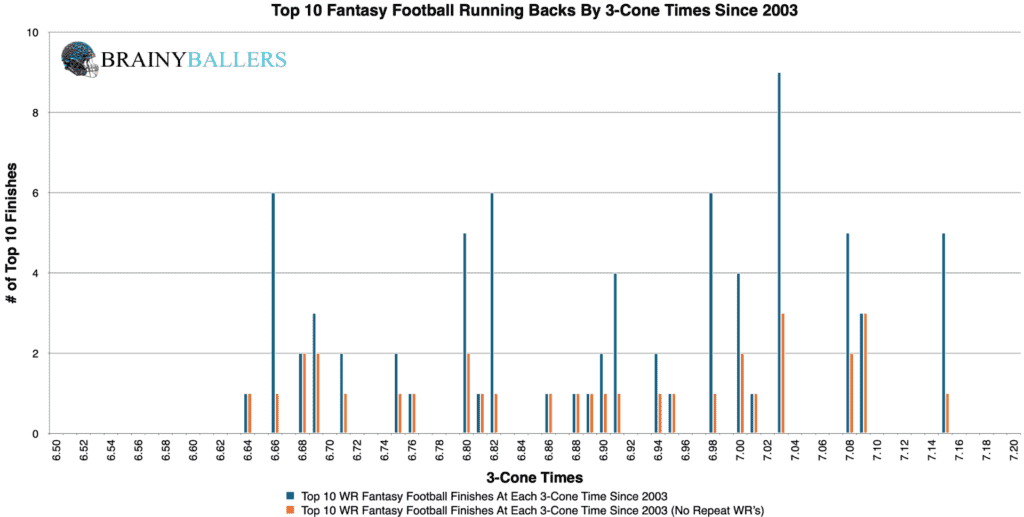
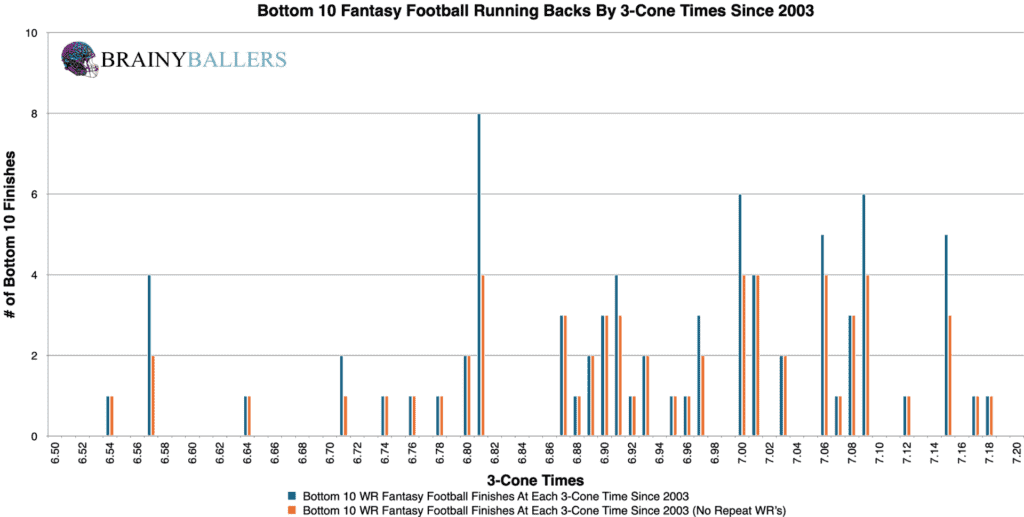
Next, we created charts of 3-Cone times segmented into 0.01-second increments. We did this for both the top and bottom 10 finishers for comparing to one another. These charts revealed that quicker 3-Cone times appeared to consistently be in the top 10 more than in the bottom 10. These charts can be seen below, with the top 10 first:
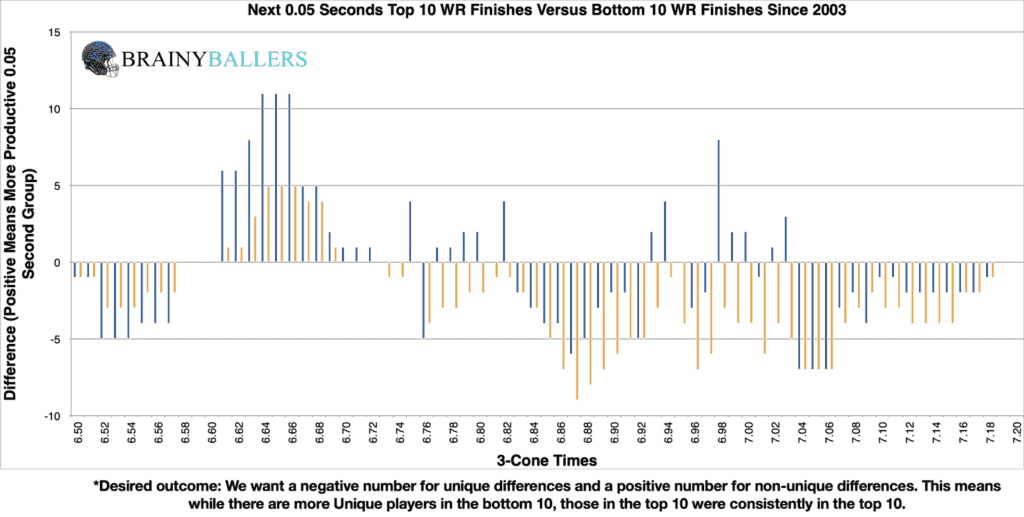
Our goal now was to identify a threshold where the highest increase in performance occurs and where the least unique players show up, which would indicate top-level consistency. This chart compares each NFL Combine 3-Cone time, plus the next 0.05 seconds, subtracting the bottom 10 results from the top 10 results. The chart’s desired outcome is a negative number for unique differences (Orange) and a positive number for non-unique differences (Blue). This would indicate the desired consistent top level performances we are hoping for. From this, it appears that 3-Cone times of 6.87 seconds marks the end of the consistently elite group. On the lower side, it appears that 6.61 seconds marks the beginning. This helped us get closer to the optimal range, which we will try to verify next.
To validate this threshold, we looked at the NFL Combine 3-Cone times of all WRs who finished in the bottom 10 since 2003. Out of 80 WRs, 19 recorded times between 6.61 to 6.87 seconds, accounting for 23.8%. This percentage serves as our baseline for the comparison to the top 10. If more than 23.8% occurs in the top 10, then we found an elite 3-Cone time range and not just an average WR 3-Cone time. You will see that comparison next.
We now compared this baseline to the 3-Cone times of all top 10 finishers from 2003 to 2023. Among these top 10 finishers, 30 out of 81 recorded times within the 6.61 to 6.87 seconds range. This accounts for 37.0%, and indicates a 13.3% increase compared to the bottom 10 finishers! Although this is great, our work didn’t stop there, as we will now try to fine-tune this range to verify whether is the optimal range.
Next is the testing of various ranges close to our initial findings from the differences chart. Through this process, we discovered that the range of 6.58 to 6.86 seconds appears in the top 10 finishers 17.0% more often than in the bottom 10 finishers! This range will be the subject of our research going forward.
Due to these findings, 3-cones could play a small factor in our Star-Predictor Score (SPS) model. Since 7.44 seconds is the slowest 3-cone time seen since 2003 in the top 10, that will be our critical value for the SPS. The Star-Predictor Score (SPS) is a scouting tool designed to maximize investment potential and reduce risks when drafting rookies in Fantasy Football. It is proven to have a higher accuracy than draft capital alone to predict fantasy success. The SPS includes 13 to 17 metrics, with the exact number varying by the player’s position. All these metrics are pre-NFL, and some are invented by us, providing a complete analysis of a player’s analytical profiles. The SPS gained widespread notoriety for its high accuracy, having made it on Barstool and The Pat McAfee Show. The SPS can be found here.
We next wanted to use standard statistical methods to see if there is a correlation between 3-cone times and fantasy production. Here are the findings:
This indicates no strong correlation between 3-Cone times and fantasy production. We are hoping for a minimum of 0.1, or an inverse correlation maximum of -0.1 when we study world-class athletes as we are. For reference to something that everyone acknowledges matters in prospect scouting, and to show the accompanying Pearson value, RB draft capital prevailed a -0.234 Pearson value.
Even though the regression testing had disappointing results, we wanted to compare our optimal 3-Cone range within the last two decades. A trend where the optimal range primarily occurs in the most recent decade by a wide margin can be observed. As you can see, there is a 38.4% increase in the frequency of the optimal range in the top 10 finishers compared to the bottom 10 when compared with the earlier decade. This suggests an increasing emphasis on agility, as measured by 3-Cone times, in determining who the top-performing WRs will be.
| 2004-2013 | |||
| Top 10 | 11 through 40 | Bottom 10 | |
| All count | 23 | 104 | 35 |
| Between 6.58 and 6.86 | 4 | 33 | 9 |
| % (hard zone/all) | 17.4% | 31.7% | 25.7% |
| 2014-2023 | |||
| Top 10 | 11 through 40 | Bottom 10 | |
| All count | 56 | 147 | 43 |
| Between 6.58 and 6.86 | 26 | 37 | 7 |
| % (hard zone/all) | 46.4% | 25.2% | 16.3% |
Both the average and median 3-Cone times in our data set were 6.94 seconds. There was 418 data entries in our spreadsheet for 3-Cone times.
What 3 metrics matter the most when scouting a rookie Quarterback? What threshold should Quarterbacks achieve within those metrics to be considered an elite prospect? How much should you value those stats above all other stats? Couldn't answer those questions? Rest easy, we have it handled for you. That's what this chart answers. Sort by importance and/or filter by position. Unlock by signing up with the links provided. $9.99/Year or $24.99 Lifetime access. Cancel anytime.
In conclusion, our study has shown that a 3-Cone time range of 6.58 to 6.86 seconds is the optimal range where top-level WR performances occur the most in the NFL. This range occured mostly in the most recent decade, and by a wide margin, indicating a new trend which we should all pay attention to. Our findings also established a critical 7.44-second 3-Cone time threshold for WRs, forming an essential time for our StarPredictor Score (SPS) model. Although, it is important to remember that the regression testing prevailed no correlation. Therefore, these results can be taken with a grain of salt. Perhaps 3-Cone times will only prevail correlation using standard statistical methods when tested alongside other metrics using multiple regression testing.
Our series has always sought to push the boundaries of sports analytics. This latest installment reaffirms our commitment to uncovering the hidden dynamics that define the game. Every Saturday, we’ll dive into intriguing questions, bust myths, and settle debates with thorough analysis. We welcome your input. Therefore, please leave comments or reach out with topics you’re eager to see dissected. Premium Analytics subscribers get priority. All of our research can be found on our Analytics Page. Up next on our agenda for Part 19 of “Does It Matter?” is an examination of QB Body Mass Index (BMI): Does it matter? If so, what’s the BMI threshold necessary for QB success? Mark your calendars; every Saturday we shed light on the topics that matter to you. If you’re a Premium Analytics subscriber, all it takes is a quick question being asked and we will go to work for you!


For our 61 part “Does It Matter?” series, we looked into whether a Wide Receiver’s College Yards After Catch per Reception (YAC/Rec)

In part 60 of our “Does It Matter?” series, we dove into the question of whether a college Wide Receiver’s career Average

The “Does It Matter?” series, part 59 looked to uncover the role of a quarterback’s rookie touchdown per game (TD/G) in predicting
