
Can Draft Capital Help Predict Tight End Success?
In our 63-part analytical series, “Does It Matter?”, we next wanted to look into the intriguing question of whether a Tight End’s


For part 16 of our “Does It Matter?” series, we looked into an intriguing question: Can NFL combine broad jumps predict NFL wide receiver success? Here are all the details of our findings and insights we discovered.
To start, we looked at the top 50 fantasy football finishers since 2003. For scoring, we used the Points Per Reception (PPR) fantasy scoring system. Throughout this article, you will see the term “bottom 10.” This refers to finishers ranked 41-50 each season.
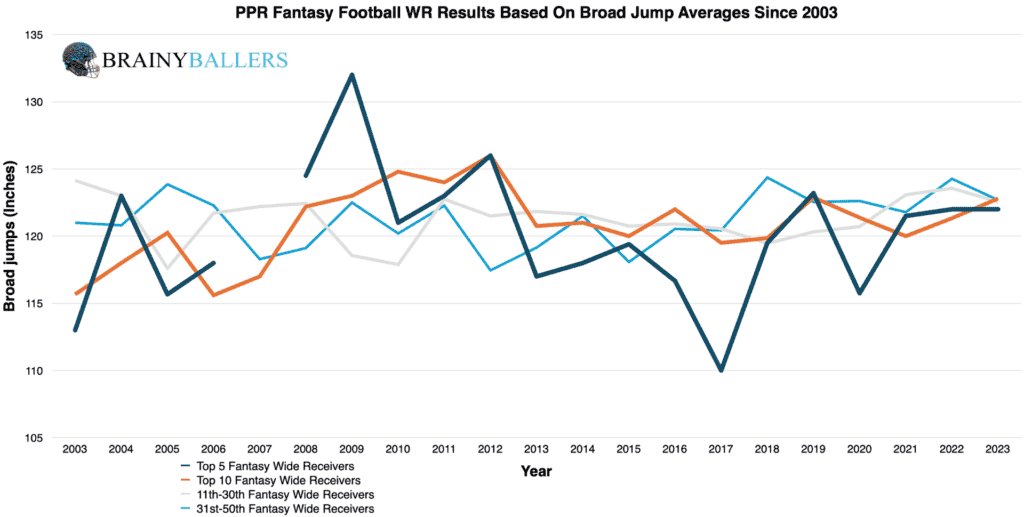
We created an averages chart for the top 5, top 10, 11-30th, and 31-50th place finishers since 2003. This chart is made to help us observe potential patterns among elite and less successful WRs. From this chart, it is tough to spot any trends.
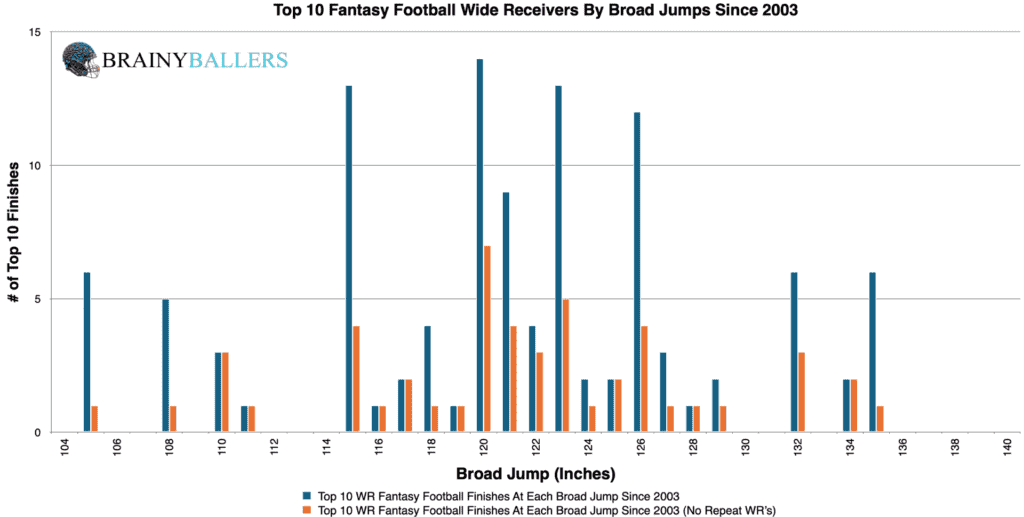
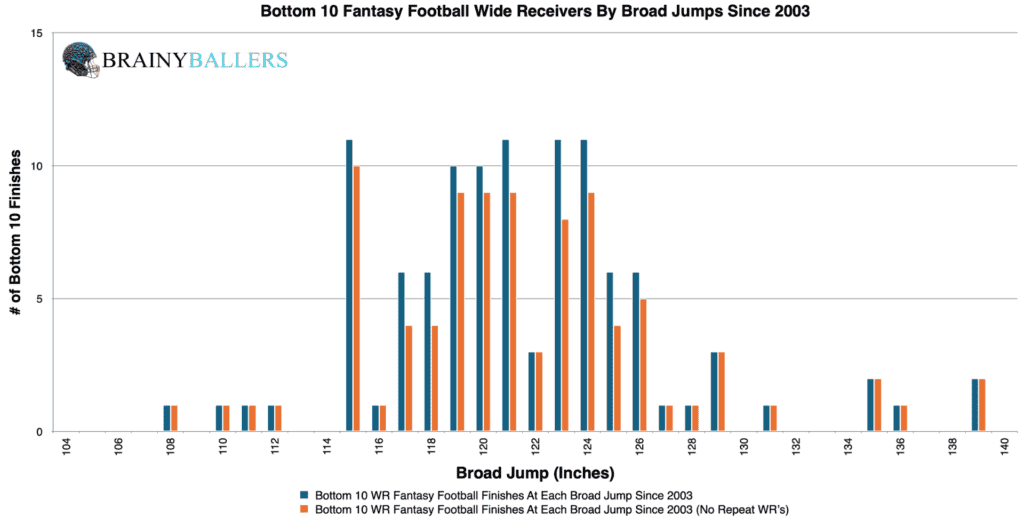
To compare top and bottom 10 finishers since 2003, we segmented out all finishers in both of these groups into 1-inch increments. The goal was to identify where the highest performance increases occur by comparing the top 10 to bottom 10 charts below. If there is any trend, it appears as though there is more weight towards higher broad jumps in the top 10 when compared to the bottom 10.
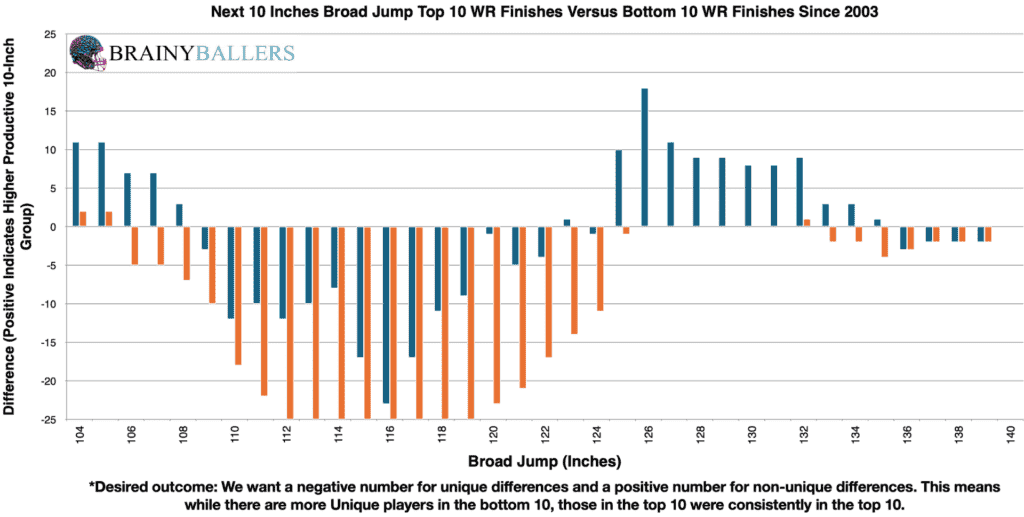
We constructed a differences chart which compares NFL Combine broad jump measurements over a 10-inch spread. By subtracting the bottom 10 results from the top 10, the goal with this was to hone in on identifying the most productive range. The chart’s desired outcome is a negative number for unique differences (Orange) and a positive number for non-unique differences (Blue). This would indicate the desired consistent top level performances we are hoping for. The findings from this chart are that the most significant performance range appears to be between 125 and 145 inches.
Next, we wanted to verify if this range was significant for all wide receivers, or specifically top-performing ones. In the bottom 10, 111 WRs completed the broad jump at the NFL Combine. Out of those 111, 23 fell into the 125-145 inch range, accounting for 20.7%. This percentage serves as a baseline for our comparison. If more than 20.7% occurs in the top 10, then we found the threshold of an average top performing WR, not just an average WR.
In the top 10 since 2003, there were 112 who had broad jump measurements taken at the combine. 34 of these 112 had a broad jump between 125-145, which equates to 30.4%, and a 9.7% increase over the bottom 10 finishers.
Our study didn’t stop at the initial increased production range we just emphasized. We upgraded our spreadsheet to be able to adjust the broad jump ranges quickly to pinpoint the highest producing range, using the 125-145 inch range as a baseline. Upon fine-tuning this range, we found that the 126 to 138-inch range occurs at a 15.1% higher rate in the top 10 versus the bottom 10 since 2003! This range will be the subject of our study going forward.
Due to these findings, vertical jumps could play a factor in our Star-Predictor Score (SPS) model. Since 105″ is the lowest broad jump seen since 2003 in the top 10, that will be our critical value for the SPS. The Star-Predictor Score (SPS) is a scouting tool designed to maximize investment potential and reduce risks when drafting rookies in Fantasy Football. It is proven to have a higher accuracy than draft capital alone to predict fantasy success. The SPS includes 13 to 17 metrics, with the exact number varying by the player’s position. All these metrics are pre-NFL, and some are invented by us, providing a complete analysis of a player’s analytical profiles. The SPS gained widespread notoriety for its high accuracy, having made it on Barstool and The Pat McAfee Show. The SPS can be found here.
Next, we looked to use standard statistical methods to see if there is a correlation between broad jump distances and fantasy production. Here are the findings:
Our Pearson Value suggests a lack of significant correlation between broad jumps and fantasy points. We are hoping for a minimum of 0.1, or an inverse correlation maximum of -0.1 when we study world-class athletes as we are. For reference to something that everyone acknowledges matters in prospect scouting, and to show the accompanying Pearson value, RB draft capital prevailed a -0.234 Pearson value.
Even though there was no regression testing support, we wanted to understand how our broad jump range evolved across the last two decades. Our results indicated similar trends in both decades, although in the most recent decade this range diminished slightly, as seen by the decrease in frequency by a 2.9%.
| 2004-2013 | |||
| Top 10 | 11 through 40 | Bottom 10 | |
| All count | 41 | 141 | 41 |
| Between 126 and 138 | 11 | 33 | 4 |
| % (hard zone/all) | 26.8% | 23.4% | 9.8% |
| 2014-2023 | |||
| Top 10 | 11 through 40 | Bottom 10 | |
| All count | 68 | 206 | 66 |
| Between 126 and 138 | 21 | 46 | 11 |
| % (hard zone/all) | 30.9% | 22.3% | 16.7% |
Across all athletes in our dataset (since 2003), we calculated an average NFL Combine broad jump distance of 121.3 inches and a median distance of 121.0 inches.
What 3 metrics matter the most when scouting a rookie Quarterback? What threshold should Quarterbacks achieve within those metrics to be considered an elite prospect? How much should you value those stats above all other stats? Couldn't answer those questions? Rest easy, we have it handled for you. That's what this chart answers. Sort by importance and/or filter by position. Unlock by signing up with the links provided. $9.99/Year or $24.99 Lifetime access. Cancel anytime.
Although broad jumps alone aren’t a standard metric for predicting NFL WR success, our data shows that a range of 126 to 138 inches is optimal. This is evident from the fact that it is more prevalent among top 10 fantasy finishers than bottom 10 finishers. This metric, while tested alongside other combine measurements, has been a valuable tool for scouting WR prospects.
Our series has always sought to push the boundaries of sports analytics. This latest installment reaffirms our commitment to uncovering the hidden dynamics that define the game. Every Saturday, we’ll dive into intriguing questions, bust myths, and settle debates with thorough analysis. We welcome your input. Therefore, please leave comments or reach out with topics you’re eager to see dissected. All of our research can be found on our Analytics Page. Up next on our agenda for Part 17 of “Does It Matter?” is an examination of the WR Shuttle drill: Does it matter? If so, what’s the Shuttle time threshold necessary for success? Mark your calendars; every Saturday we shed light on the topics that matter to you. All it takes is a quick question being asked and we will go to work for you!


In our 63-part analytical series, “Does It Matter?”, we next wanted to look into the intriguing question of whether a Tight End’s

For our 61 part “Does It Matter?” series, we looked into whether a Wide Receiver’s College Yards After Catch per Reception (YAC/Rec)

In part 60 of our “Does It Matter?” series, we dove into the question of whether a college Wide Receiver’s career Average
