
Tight Ends: Can College Yardage Help Predict NFL Success?
When evaluating talent for the NFL, analysts often look at a player’s college performance to predict their professional success. In our 64-part


For part 15 of our “Does It Matter?” series, we looked into vertical jumps and whether they can help predict NFL Wide Receiver success. After number crunching, we discovered an optimal range which you can apply to scouting new prospects. Here’s a detailed breakdown of our research.
To ensure consistency, we focused exclusively on NFL Draft Combine numbers. Further, we looked only at the top 50 fantasy football finishers since 2003. Our database relied specifically on PPR (Points Per Reception) fantasy scores. Throughout this study, you will hear the “Bottom 10” which is defined as fantasy football finishers 41-50th place every year.
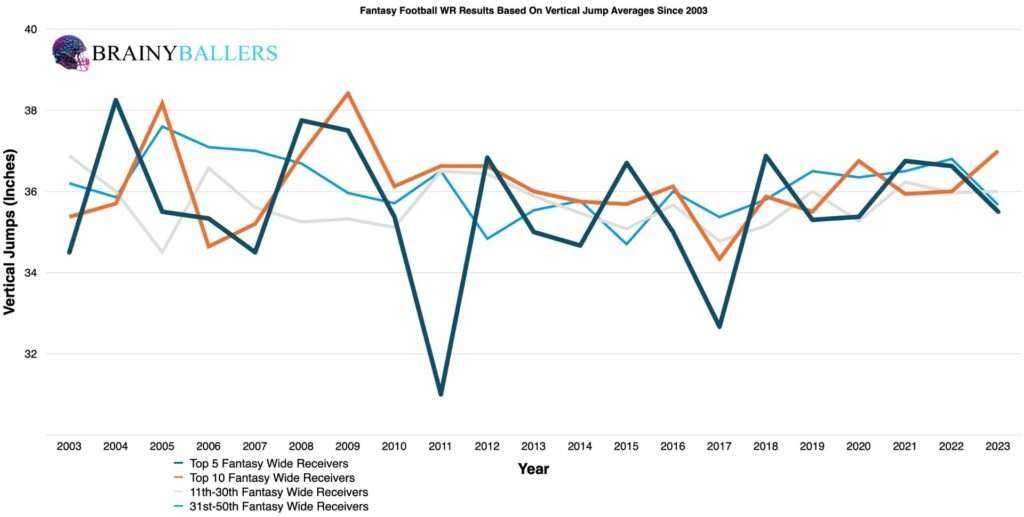
To attempt to visually identify any obvious trends, we created an averages chart which divides the top 50 finishers since 2003 into four groups. The four groups are as follows:
From this chart, it was difficult to identify any trends. The top 10 finishers (orange line) finished at or above the 31st-50th place finishers (light blue line) just above half of the seasons (12/21 times). The chart can be seen here:
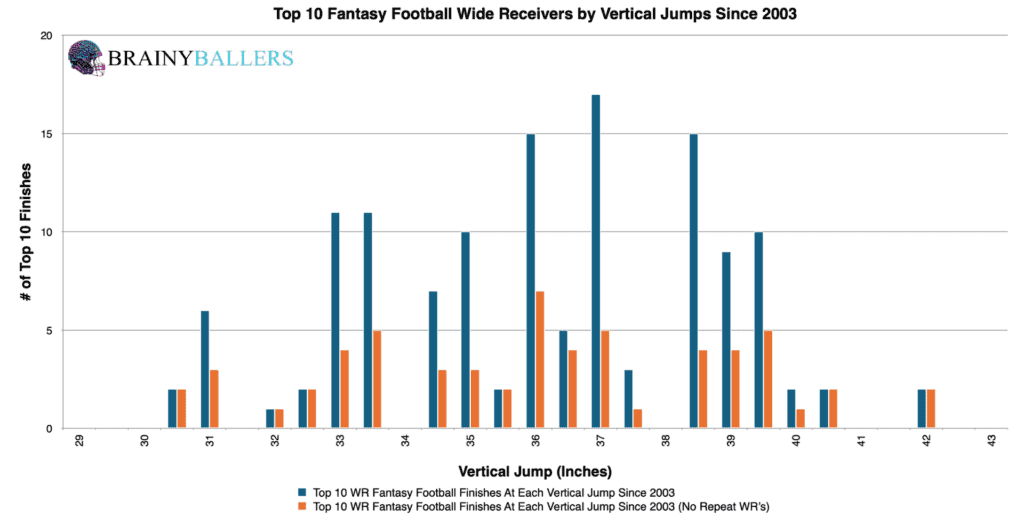
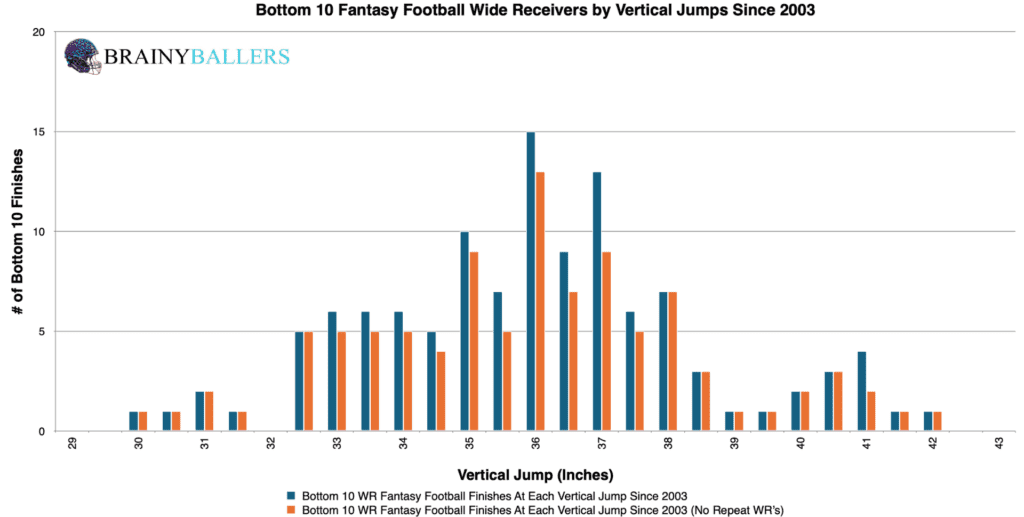
We then charted the top 10 Wide Receiver finishers from 2003 to 2023, segmenting their vertical jumps into each 0.5-inch increment. We did the same for the bottom 10 finishers to compare back to the top 10 chart. This hopefully would prevail an obvious visual difference between the charts which could lead us to focus on higher vertical jumps (or lower, unexpectedly). It does appear from these that the top 10 chart has more high vertical jumps than the bottom 10.
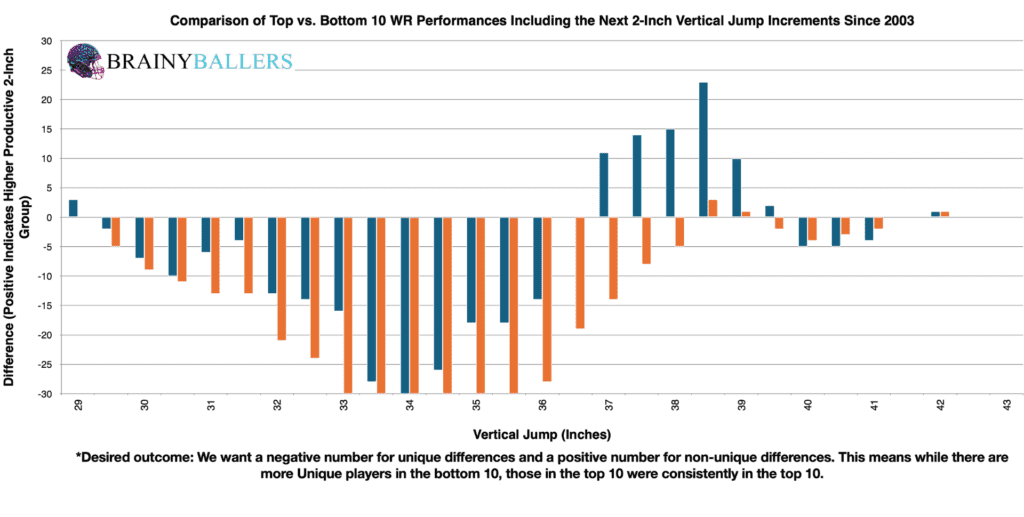
As is the basis of all of our studies, we now turn our attention to identify a vertical jump threshold that is related with higher performances using our differences chart. This chart compared each vertical jump measurement plus the next 2 inches, subtracting the bottom 10 results from the top 10. The chart’s desired outcome is a negative number for unique differences (Orange) and a positive number for non-unique differences (Blue). This would indicate the desired consistent top level performances we are hoping for. The findings from this chart were that a vertical jump of 37 inches appeared to be the minimum threshold for top-level WR performance.
To validate our threshold, we compared the vertical jump threshold (37 inches and above) to WRs who finished in the bottom 10 since 2003. Out of 123 WRs, 44 achieved a vertical jump of 37 inches or more, accounting for 35.8%. This percentage served as a baseline for our comparison. If more than 35.8% occurs in the top 10, then we found the threshold of an average top performing WR, not just an average WR.
Among the top 10 WR finishers from 2003-2023, we found that 61 out of 135 finishers had a vertical jump of 37 inches or more, which equals 45.2%. This represented a 9.4% increase over the bottom 10 finishers, suggesting that WRs with higher vertical jumps are more likely to be top performers.
We recently upgraded our spreadsheet to allow for quick adjustments, and therefore, precise identification and verification of the highest producing vertical jump threshold. By testing various vertical jump ranges, we found that a vertical jump of 38.5 inches and above occurs 15.7% more often in the top 10 than in the bottom 10. Since this is the top producing threshold that we could find, this threshold will be the focus of our study going forward.
Due to these findings, vertical jumps could play a factor in our Star-Predictor Score (SPS) model. The Star-Predictor Score (SPS) is a scouting tool designed to maximize investment potential and reduce risks when drafting rookies in Fantasy Football. It is proven to have a higher accuracy than draft capital alone to predict fantasy success. The SPS includes 13 to 17 metrics, with the exact number varying by the player’s position. All these metrics are pre-NFL, and some are invented by us, providing a complete analysis of a player’s analytical profiles. The SPS gained widespread notoriety for its high accuracy, having made it on Barstool and The Pat McAfee Show. The SPS can be found here.
Next we utilized standard statistical methods, namely coefficient values. This is to assess the correlation between WR vertical jumps and fantasy points. Here are the weight regression testing numbers:
This shows that there is no strong correlation between WR vertical jumps and fantasy points. We are hoping for a minimum of 0.1, or an inverse correlation maximum of -0.1 when we study world-class athletes as we are. For reference to something that everyone acknowledges matters in prospect scouting, and to show the accompanying Pearson value, RB draft capital prevailed a -0.234 Pearson value.
Despite no regression testing support, we wanted to compare our optimal threshold across the last two decades for the believers in this metric. That breakdown can be seen below, where the most recent decade showed a 6.7% decline in the frequency of our vertical jump threshold in the top 10 when comparing the bottom 10 to the top 10 across both decades.
| 2004-2013 | |||
| Top 10 | 11 through 40 | Bottom 10 | |
| All count | 55 | 203 | 51 |
| At and above 38.5 | 17 | 52 | 6 |
| % (hard zone/all) | 30.9% | 25.6% | 11.8% |
| 2014-2023 | |||
| Top 10 | 11 through 40 | Bottom 10 | |
| All count | 72 | 214 | 66 |
| At and above 38.5 | 22 | 44 | 12 |
| % (hard zone/all) | 30.6% | 20.6% | 18.2% |
What 3 metrics matter the most when scouting a rookie Quarterback? What threshold should Quarterbacks achieve within those metrics to be considered an elite prospect? How much should you value those stats above all other stats? Couldn't answer those questions? Rest easy, we have it handled for you. That's what this chart answers. Sort by importance and/or filter by position. Unlock by signing up with the links provided. $9.99/Year or $24.99 Lifetime access. Cancel anytime.
While vertical jumps alone are not definitive predictors, the 38.5 and above increased frequency in top-tier fantasy performances is undeniable. Although, standard statistical methods show no significant correlation between vertical jumps and fantasy football production. We cannot wait to see what happens when we begin using multiple regression to test vertical jumps alongside other metrics to find definitive correlation using standard methods.
Our series has always sought to push the boundaries of sports analytics. This latest installment reaffirms our commitment to uncovering the hidden dynamics that define the game. Every Saturday, we’ll dive into intriguing questions, bust myths, and settle debates with thorough analysis. We welcome your input. Therefore, please leave comments or reach out with topics you’re eager to see dissected. All of our research can be found on our Analytics Page. Up next on our agenda for Part 16 of “Does It Matter?” is an examination of WR Broad Jumps: Do they matter? If so, what’s the Broad Jump threshold necessary for success? Mark your calendars; every Saturday we shed light on the topics that matter to you. All it takes is a quick question being asked and we will go to work for you!


When evaluating talent for the NFL, analysts often look at a player’s college performance to predict their professional success. In our 64-part

In our 63-part analytical series, “Does It Matter?”, we next wanted to look into the intriguing question of whether a Tight End’s

For our 61 part “Does It Matter?” series, we looked into whether a Wide Receiver’s College Yards After Catch per Reception (YAC/Rec)
