
Tight Ends: Can College Yardage Help Predict NFL Success?
When evaluating talent for the NFL, analysts often look at a player’s college performance to predict their professional success. In our 64-part


For the 24th installment of our “Does It Matter?” series, we dive into the world of NFL Running Backs to understand if Rushing Yards Over Expected (RYOE) can accurately predict future success. By analyzing our data we collected, we discovered an interesting pattern. All of our findings are laid out here.
To form our analysis, we focused on the top 50 fantasy football finishers each season since 2008, since that is the first season RYOE data is available for. We specifically attached each player’s Rookie RYOE to their yearly performances. Our Fantasy points system was PPR (points per reception) fantasy scores. Throughout this study, you will hear the term “bottom 10”. This is defined as those ranked 41st-50th in fantasy finishes each season. All numbers within this article are rounded to the nearest tenth (0.1). All of our data was sourced from mfb analytics, put together by Tej Seth at PFF.
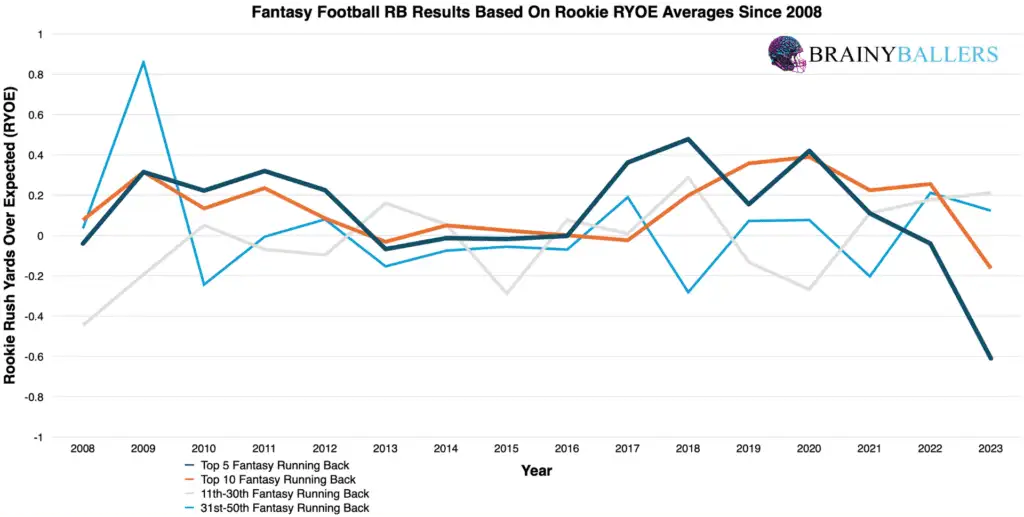
Our first goal was to compare different groups in the top 50 with one another to see if there are any noticeable trends. We categorized the top 50 finishers into four distinct groups based on their placement:
The results were obvious. In 12 of the 16 seasons, the top 10 finishers had higher Rookie RYOE than the 31st-50th place finishers. This pattern suggests that RBs with higher Rookie RYOE scores perform better in fantasy football, consistently ranking among the top producers.
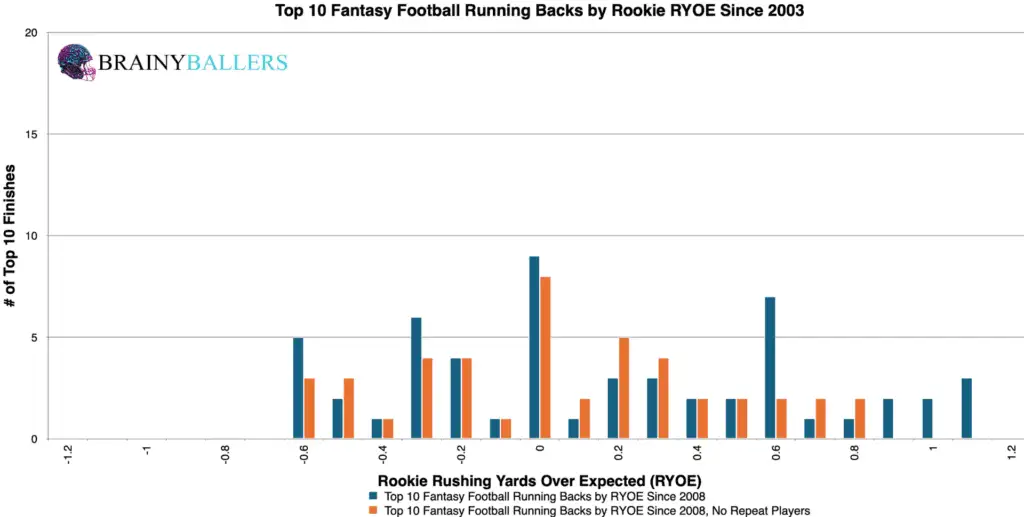
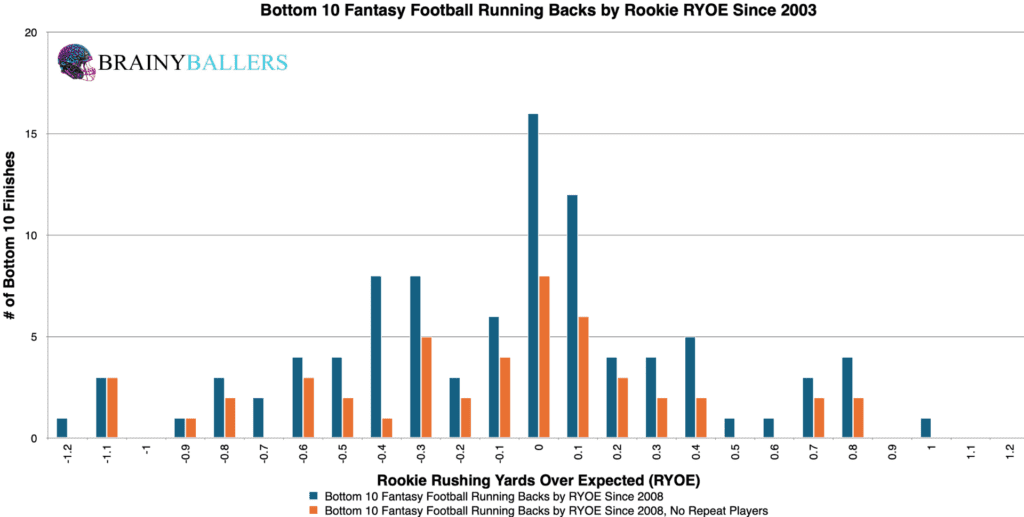
To continue diving deeper, we created a chart specifically for the top and bottom 10 finishers since 2008, once again using only Rookie RYOE data. We segmented this data into increments of 0.1 RYOE. The chart revealed a subtle trend: as the RYOE score increases, the prevalence of finishes appeared to occur more frequently in the top 10 than in the bottom 10. These two charts can be seen below, with the top 10 first:
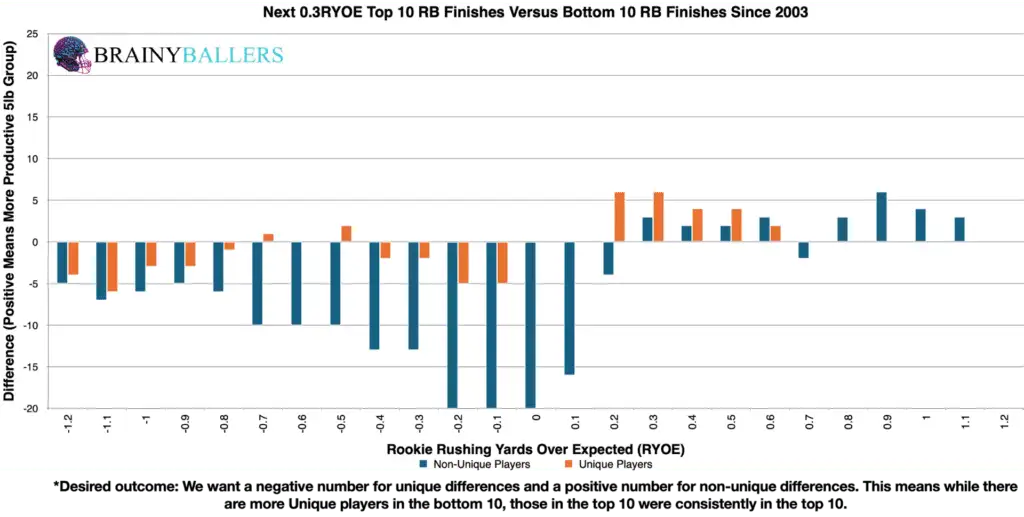
In our quest to identify the optimal range for Rushing Yards Over Expected (RYOE), we created a differences chart. This compares each RYOE increment plus the next 0.3 RYOE, subtracting the bottom 10 results from the top 10 results. The chart’s desired outcome is a negative number for unique differences (Orange) and a positive number for non-unique differences (Blue). This would indicate the desired consistent top level performances we are hoping for. This analysis revealed that a threshold of 0.3 RYOE and above appeared to be the the most effective range for future performances. This approach got us closer to identifying the optimal range for top-performing RBs, which we will verify next.
To verify our findings, we looked at how many RBs were above this RYOE threshold amongst those who placed in the bottom 10 since 2008. Out of a dataset including 98 Running Backs, 27 achieved RYOE of 0.3 and above, representing 27.6%. This serves as our baseline to distinguish whether we found an average performing Rookie RB’s RYOE, or an average top-performing Rookie RB RYOE.
If more than 27.6% occurs within the top 10, then we found a top-performing RB Rookie RYOE range. Among 111 top 10 finishers, 53 fell into the 0.3 RYOE threshold and above, accounting for 47.7%. This signifies a 20.2% increase, indicating that this threshold could indeed be the top-performing range.
We now wanted to manually fine-tune this range to see if we can find the actual optimal range, or to verify 0.3 and above as the optimal range. Through numerous tests, the range of 0.2 to 1.3 RYOE yielded a 24.3% higher appearance rate in the top 10 than the bottom 10. Therefore, this is our optimal range, and will be the subject of this research going forward.
Due to these findings, RYOE could play a factor in our Post-Rookie Star-Predictor Score (SPS) model. Since -0.67 RYOE is the lowest seen since 2003 in the top 10, this will be the critical value for the SPS. The Star-Predictor Score (SPS) is a scouting tool designed to maximize investment potential and reduce risks when drafting rookies in Fantasy Football. It is proven to have a higher accuracy than draft capital alone to predict fantasy success. The SPS includes 13 to 17 metrics, with the exact number varying by the player’s position. All these metrics are pre-NFL, and some are invented by us, providing a complete analysis of a player’s analytical profiles. The SPS gained widespread notoriety for its high accuracy, having made it on Barstool and The Pat McAfee Show. The SPS can be found here.
Our statistical analysis reveals a near correlation between RYOE and fantasy production. These results are as follows:
This Pearson Value indicates no significant correlation between RYOE and future fantasy points. We are hoping for a minimum of 0.1, or an inverse correlation maximum of -0.1 when we study world-class athletes as we are. For reference to something that everyone acknowledges matters in prospect scouting, and to show the accompanying Pearson value, RB draft capital prevailed a -0.234 Pearson value.
For our decades breakdown, the key trend is the 14.2% increase in the occurrence of our identified optimal RYOE range among the top 10 finishers when compared to the bottom 10 finishers in the most recent decade. This jump indicates a stronger presence of efficient runners who exceed expectations in their performance. This decadal breakdown can be seen below:
| 2004-2013 | |||
| Top 10 | 11 through 40 | Bottom 10 | |
| All count | 29 | 83 | 29 |
| All 0.2 to 1.3 | 11 | 21 | 7 |
| % (Optimal Range/all) | 37.9% | 25.3% | 24.1% |
| 2014-2023 | |||
| Top 10 | 11 through 40 | Bottom 10 | |
| All count | 82 | 233 | 69 |
| All 0.2 to 1.3 | 42 | 83 | 16 |
| % (Optimal Range/all) | 51.2% | 35.6% | 23.2% |
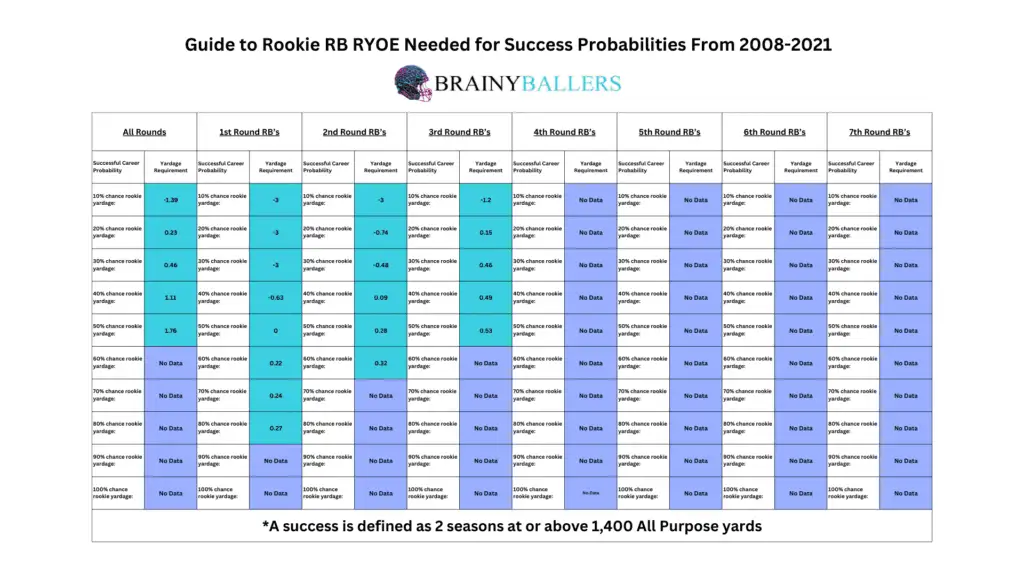
For those who wish to use RYOE data religiously, we created a detailed graphical guide to help you track and analyze career success probabilities for rookie running backs. Using historical data, this guide features easy-to-read charts and graphs that visually represent various RYOE values needed to achieve various future performance probabilities. This allows you to follow your favorite rookie RBs after their rookie season (if RYOE data becomes available after the season), keeping an eye on their potential for long-term success. Additionally, the guide is a valuable tool for identifying sleeper RBs—those less obvious players who have a higher chance of achieving 2-1,400 All Purpose yard seasons in their career. By leveraging this graphical guide, you can make more informed decisions in fantasy leagues or just enjoy a deeper understanding of the game.
What 3 metrics matter the most when scouting a rookie Quarterback? What threshold should Quarterbacks achieve within those metrics to be considered an elite prospect? How much should you value those stats above all other stats? Couldn't answer those questions? Rest easy, we have it handled for you. That's what this chart answers. Sort by importance and/or filter by position. Unlock by signing up with the links provided. $9.99/Year or $24.99 Lifetime access. Cancel anytime.
Our number-crunching for part 25 of the “Does It Matter?” series found that the optimal range for Rookie RB RYOE is 0.2 to 1.3 RYOE (rounded). The decade comparison of RYOE reveals significant trends and their rising presence in top RBs, although these findings were a near miss on regression testing.
Our series has always sought to push the boundaries of sports analytics. This latest installment reaffirms our commitment to uncovering the hidden dynamics that define the game. Every Saturday, we’ll dive into intriguing questions, bust myths, and settle debates with thorough analysis. We welcome your input. Therefore, please leave comments or reach out with topics you’re eager to see dissected. All of our research can be found on our Analytics Page. Up next on our agenda for Part 25 of “Does It Matter?” is an examination of TE 40: Does it matter? If so, what’s the 40-time threshold necessary for success? Mark your calendars; every Saturday we shed light on the topics that matter to you. All it takes is a quick question being asked and we will go to work for you!


BrainyBallers Buy-Hold-Sell Chart (All Players)
Get Your Products 100% Refunded By Predicting The Next SuperBowl Winner!
When evaluating talent for the NFL, analysts often look at a player’s college performance to predict their professional success. In our 64-part

In our 63-part analytical series, “Does It Matter?”, we next wanted to look into the intriguing question of whether a Tight End’s

For our 61 part “Does It Matter?” series, we looked into whether a Wide Receiver’s College Yards After Catch per Reception (YAC/Rec)
