Can Rookie Passing TD’s Per Game Help Predict Future QB Success?
The “Does It Matter?” series, part 58 looked to uncover the role of a quarterback’s rookie touchdown per game (TD/G) in predicting


For the 26th edition of our “Does It Matter?” series, we dove into the potential correlation between NFL Combine 40-yard dash times and NFL Tight End success. By analyzing the data we collected, we found a strong correlation and an optimal 40-time range at which increased chances of NFL success occurs. Here are all of our findings:
Our research consisted of only the top 50 fantasy football finishers since 2003. We used PPR (Points Per Reception) fantasy scores since it is the most widely used scoring system in fantasy football. The 40-yard dash times used in this study were strictly sourced from official NFL Combine results and no Pro Day results were used. For clarity, in this article you will see the term “bottom 10”. This is defined as the TEs who finished 41st-50th each season.
Why the top 50? The reason we chose the top 50 is to find a happy medium. We don’t want to go further than the top 50 and start getting close to the fringe roster members whom obviously are not going to score top 10. These players could therefore just weigh the data. On the other hand, We want to compare the worst to the best still. Comparing the top 10 to the 11th place finisher, or an average number that takes into account the 11th place finisher, doesn’t satisfy our personal itch to try to find trends.
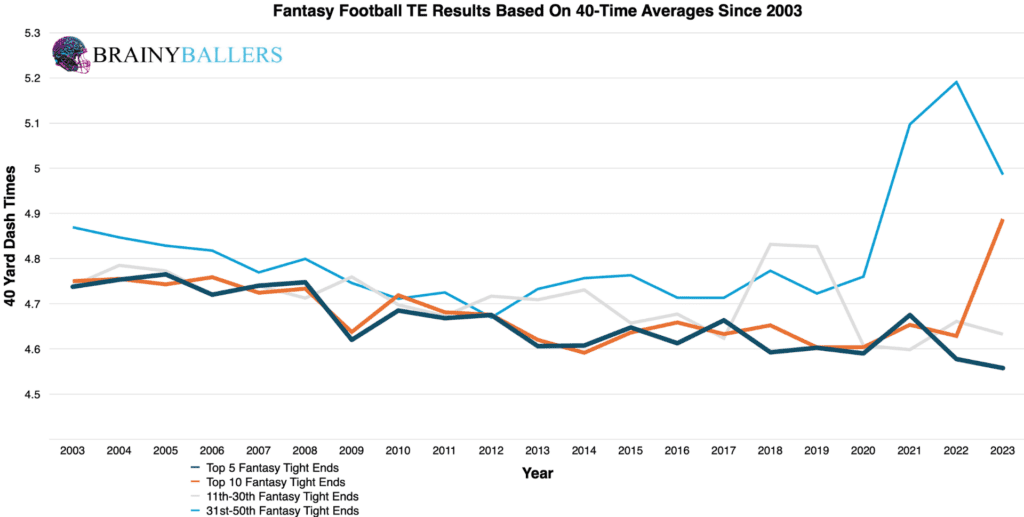
To find overall patterns and trends, we created an averages chart of the 40-yard dash times for top-performing TEs across various brackets: the top 5, top 10, 11-30th, and 31-50th place finishers since 2003.
From our chart, a clear trend emerged: lower 40-yard dash times were more frequently associated with the top-producing TEs. Over the span of 21 seasons, the top 10 finishers consistently had the same, or faster, 40 times compared to those in the 31st-50th bracket. This gave us hope for a strong correlation possibility.
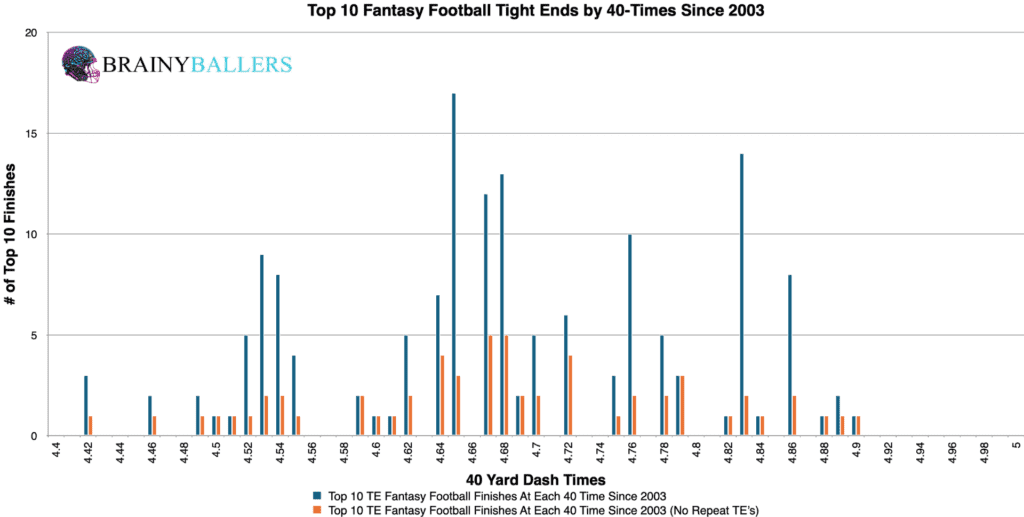
To further narrow down the correlation, we segmented the 40-yard dash times of top 10 finishers into 0.01-second increments. This approach showed us that the lower the 40-yard dash time, the more frequently TEs appeared in the top 10, suggesting a connection between speed and high-level fantasy production.
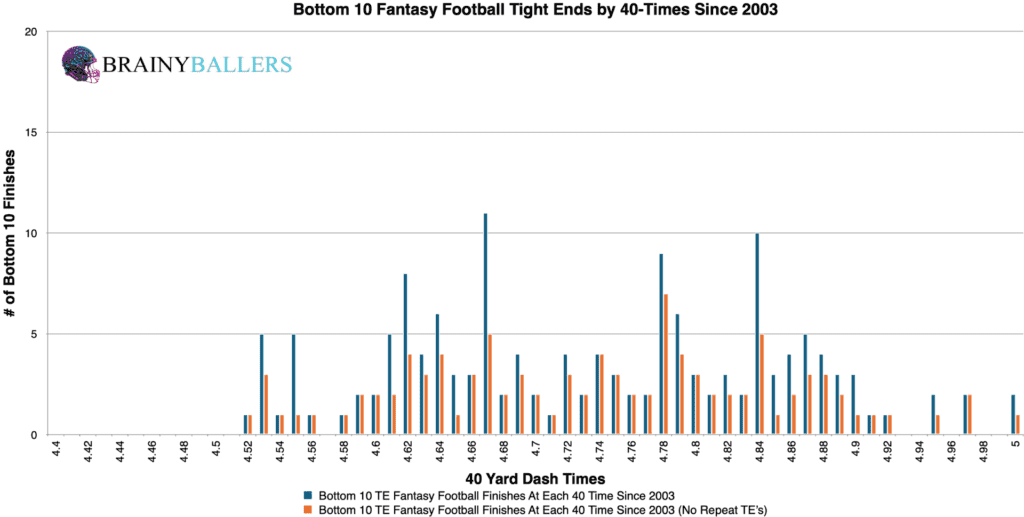
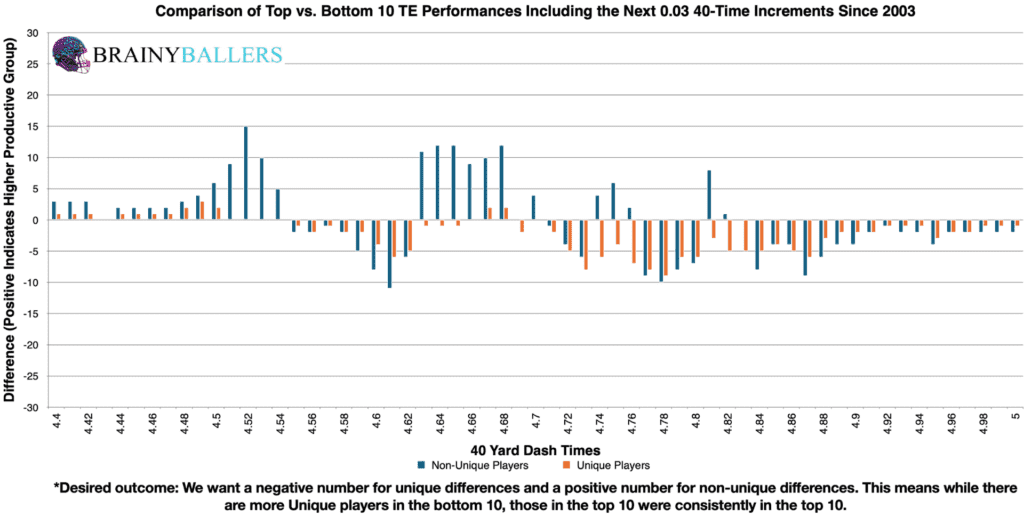
To identify the optimal 40-yard dash time threshold, or range, that correlates to higher performances while minimizing the variance of players, we created a differences chart. This involved comparing each 0.01 40-yard dash time, plus the next 0.03 seconds. Essentially, we subtracted the bottom 10 results from the top 10. The chart’s desired outcome is a negative number for unique differences (Orange) and a positive number for non-unique differences (Blue). This would indicate the desired consistent top level performances we are hoping for. This analysis got us closer to our optimal range, which from this appears to be a 40-time of 4.68 seconds and below.
To substantiate our findings, we wanted to see how often this 40-time range occurred amongst all TEs who finished in the bottom 10 since 2003. Out of 153 TEs, 62 had 40-times of 4.68 seconds or below, accounting for 40.5%. This served as our baseline for comparison to the top 10. This will show us whether we found an average TE 40-time, or if we found an average top performing TE 40-time.
We then evaluated the top 10 performers during the same period (2003-2023). Among the 159 top finishers, 97 achieved 40-times within the 4.68 seconds or below range, translating to 61.0%. This showcased a 20.5% increase when compared to the baseline, indicating a potential correlation situation between 40-yard dash times and fantasy production. Next, we will attempt to verify this range as the top performing range.
To validate and possibly refine the optimal threshold, we enhanced our spreadsheet to quickly adjust our ranges to identify the most productive ones. After testing various ranges around the initial finding, we discovered that adjusting the threshold to 4.76 seconds and below found a top 10 increased appearance rate by 22.5% over the bottom 10. This will be the subject of our study going forward.
The critical value is simply the threshold at which an outcome change could occur. For our SPS system, critical values are going to be set for determining probable busts based on their 40-times. We broke it down into several thresholds for your insight:
Due to this, the threshold of 4.95 seconds is now the critical threshold for TEs in attempting to predict successes and busts, which will be the basis of our StarPredictor Score (SPS) model. Essentially, Tight Ends must have a 4.95 or below 40-time in order to not be considered a future bust by our model. We are hoping to have this model fully functional by the beginning of the 2025 NFL season. You can subscribe to our mailing list to get updates on this model when it begins coming out here:
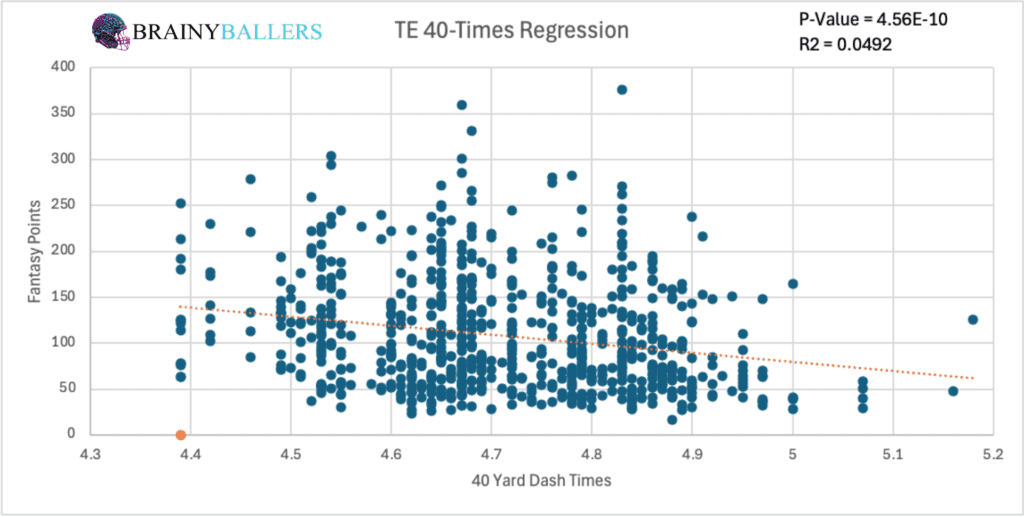
Our statistical analysis confirmed a strong correlation between 40-times and fantasy production. The breakdown is as follows:
When studying world-class athletes as we are, an R² value of 0.01 (1.0%) and above is what we are hoping for. The trend line in our regression chart shows the correlation between lower 40-times and higher fantasy production. Simply put, this means athletes with a lower 40-times are likely to perform better in fantasy football.
We next wanted to classify our data into three groups across the last two decades to see if there are any emerging or dying trends. These three groups are as follows: top 10, 11-40th place finishers, and the bottom 10. As you can see in the most recent decade, there was a 18.2% increase in the rate where our optimal 40-time range showed up in the top 10 more than in the bottom 10 when compared to earlier decades. This shows an increased significance of 40-times in predicting top Tight End performance.
| Top 10 | 11 through 40 | Bottom 10 | |
| All count | 81 | 239 | 76 |
| All 4.76 and below | 51 | 119 | 41 |
| % (Optimal Range/all) | 63.0% | 49.8% | 53.9% |
| 2014-2023 | |||
| Top 10 | 11 through 40 | Bottom 10 | |
| All count | 72 | 207 | 70 |
| All 4.76 and below | 69 | 155 | 41 |
| % (Optimal Range/all) | 95.8% | 74.9% | 58.6% |
We applied our findings to evaluate the 2024 rookie TE class. Matching their 40-times against our identified optimal range, here is the breakdown:
From our analysis, it’s evident that 40-yard dash times are a great indicator of TE success in Fantasy Football. Ultimately, while other factors certainly also contribute to a player’s success, our findings show the significance of a fast 40-yard dash time as a valuable predictor, solidifying its place in the scouting and drafting strategies of NFL teams and fantasy football managers. In particular, the 4.76 seconds and below range emerged as the most consistent and highest-producing 40-time threshold for TEs.
Our series has always sought to push the boundaries of sports analytics. This latest installment reaffirms our commitment to uncovering the hidden dynamics that define the game. Every Saturday, we’ll dive into intriguing questions, bust myths, and settle debates with thorough analysis. We welcome your input. Therefore, please leave comments or reach out with topics you’re eager to see dissected. All of our research can be found on our Analytics Page. Up next on our agenda for Part 27 of “Does It Matter?” is an examination of RB Best College Yardage Season: Does it matter? If so, what’s the yardage threshold necessary for NFL success? Mark your calendars; every Saturday we shed light on the topics that matter to you. All it takes is a quick question being asked and we will go to work for you!
What metric matters the most when scouting a rookie Running Back? What threshold should Running Backs achieve within that metric to be considered an elite prospect? How much should you value that stat above all other stats? Couldn't answer those questions? Rest easy, we have it handled for you. That's what this chart answers. Sort by importance and/or filter by position. Unlock by signing up with the links provided. $9.99/Year or $24.99 Lifetime access. Cancel anytime.
BrainyBallers Buy-Hold-Sell Chart (All Players)
Make Money on BrainyBallers’ (Or anyone’s) content if it turns out to be incorrect!
Get Your Products 100% Refunded By Predicting The Next SuperBowl Winner!
The “Does It Matter?” series, part 58 looked to uncover the role of a quarterback’s rookie touchdown per game (TD/G) in predicting
Having mapped out each position within our analytical model which predicts Fantasy Football points, we can now get a full picture of
For our 57th installment of the “Does It Matter?” series, we looked into whether a quarterback’s rookie Yards Per Game (YPG) can
