
Can College Yards After Catch Help Predict NFL Success For Wide Receivers?
For our 61 part “Does It Matter?” series, we looked into whether a Wide Receiver’s College Yards After Catch per Reception (YAC/Rec)


For part 31 of our “Does It Matter?” series, we looked into the question of whether a Defensive Back’s Relative Athletic Score (RAS) can predict their success in the NFL. From this, we uncovered a specific range where RAS consistently appears more in the top fantasy football finishers compared to the bottom finishers. Here are all of our findings:
Relative Athletic Score (RAS) is a metric used to evaluate the athleticism of NFL prospects based on their performances in Combine and Pro Day drills. Developed by Kent Lee Platte in 2013, RAS takes various physical attributes such as speed, agility, explosiveness, and size to normalize them on a scale from 0 to 10. The results are then color-coded to provide a quick visual comparison of a player’s athletic traits relative to other players of the same position. This system helps teams and analysts quickly assess the athletic potential of prospects. Us at BrainyBallers have used RAS religiously in evaluating talents.
Our study focused on NFL players who finished in the top 50 fantasy football finishers every year since 2003. We defined the “bottom 10” as those finishing 41st to 50th place each season.
Why the top 50? We chose the top 50 to maintain a “happy medium” in our analysis. If we looked beyond the top 50, we’d start including players who are on the edge of staying on an NFL roster. These fringe players are obviously not likely to score in the top 10, and could only skew our data. Although, we wanted to compare the best to the worst performers within a reasonable range. Simply comparing the top 10 to the 11th place, or including an average number which includes the 11th place doesn’t fulfill our personal itch of identifying meaningful trends. By focusing on the top 50, we ensure a broad, yet relevant, comparison without diluting the significance of standout performances.
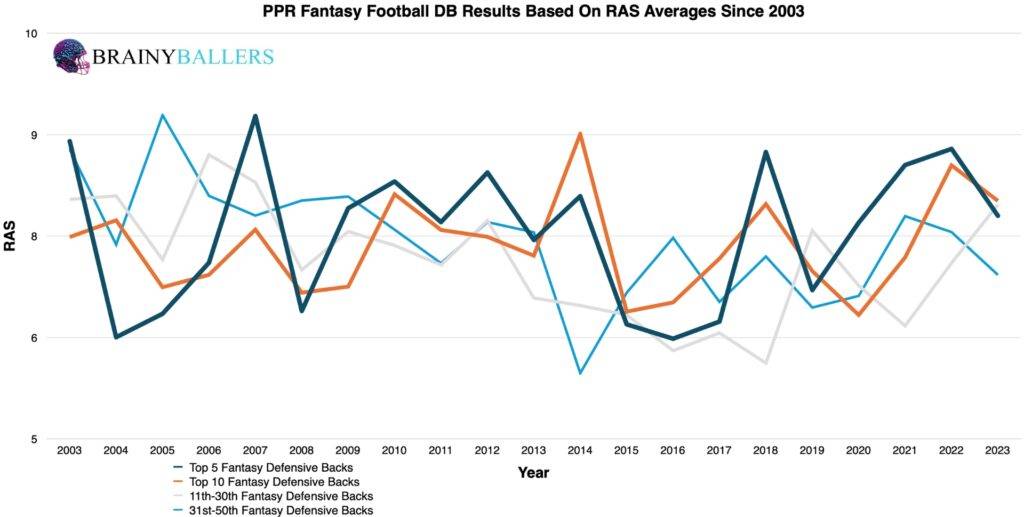
To begin our analysis, we created an averages chart which categorizes players into four groups: top 5, 10, 11-30th, and 31-50th since 2003. Surprisingly, no clear trends emerged from these charts. In 12 out of 21 seasons (57.1%), the top 10 finishers had the same or higher RAS than those who finished 31st-50th. This caused initial doubt in RAS as a meaningful metric, as the averages chart seems to be a good predictor of how the linear regression typically will pan out.
Further, we segmented the top 10 finishers since 2003 into increments of 0.1 RAS. This segmentation revealed only a possible slight emphasis on higher RAS scores amongst the top 10. The mere slight weight difference of these charts showed that RAS might not be the decisive factor we’d hoped for in differentiating elite fantasy players from average ones. Those charts can be seen below, with the top 10 first.
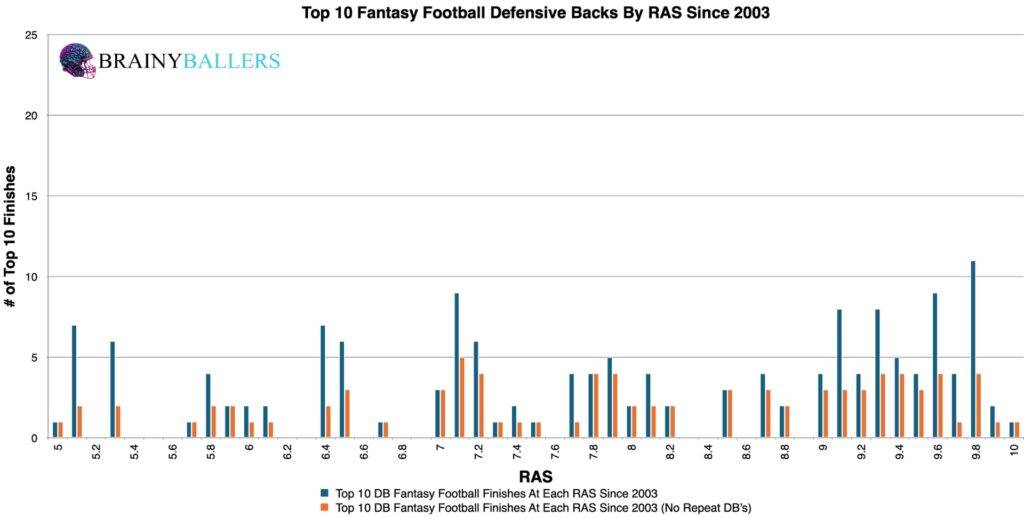
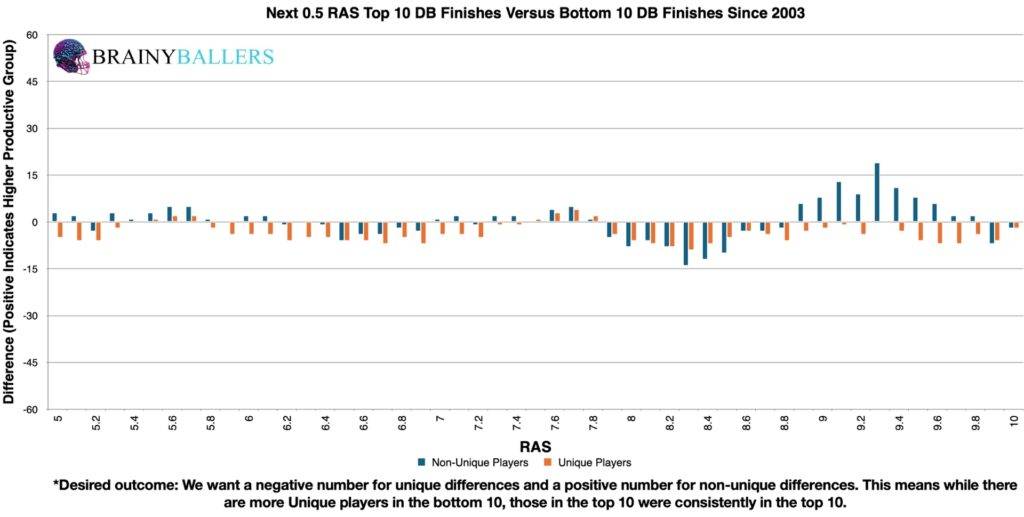
In our quest to discover the RAS (Relative Athletic Score) threshold that indicates the highest likelihood of NFL success for Defensive Backs, we created a differences chart. The chart’s desired outcome is a negative number for unique differences (Orange) and a positive number for non-unique differences (Blue). This would indicate the desired consistent top level performances we are hoping for. By looking at each RAS score, adding the next 0.5 RAS increment, and subtracting the bottom 10 results from the top 10 results, we noticed that a RAS of 8.9 and above seems to correlate with high-performing DBs. This gave us a good threshold to explore further.
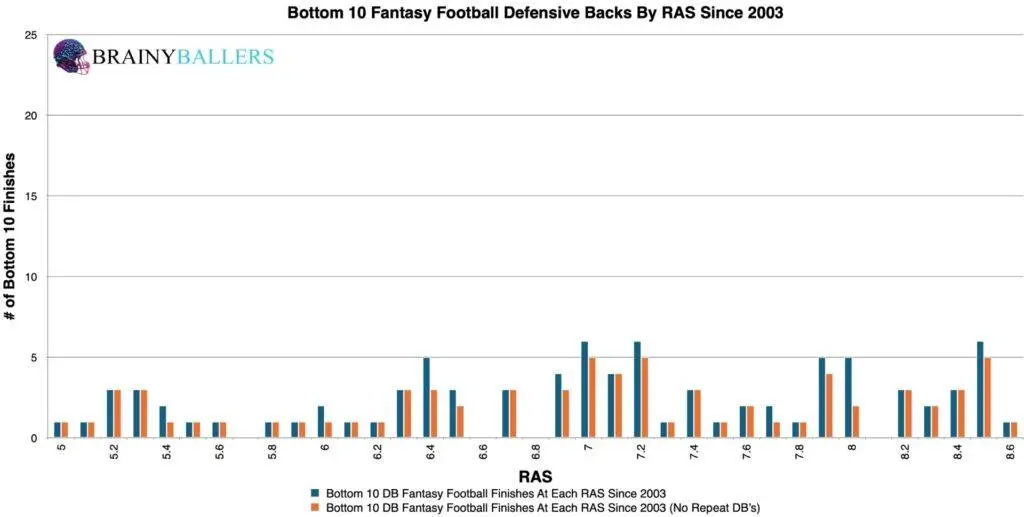
To validate this threshold, we compared the RAS scores of all DBs who finished in the bottom 10 from 2003 onwards. Out of 164 DBs, 46 had a RAS of 8.9 or higher, accounting for 28.0% of this group. Our goal was to see if a similar or higher percentage appeared in the top 10, indicating whether this RAS range is common among top-performing DBs or just all DB’s. That will be evaluated next.
Amongst the 173 DBs who finished in the top 10 between 2003 and 2023, 60 players had a RAS of 8.9 or higher. This represents 34.7% of top 10 finishers, a 6.6% increase from the bottom 10 group. This suggests that we may have identified an average top-performing DB’s RAS rather than just an average RAS for all DB’s. Although this is great, this is very unspectacular compared to all our T10 to B10 findings for other metrics.
Using our spreadsheet, we experimented with different RAS ranges to determine the most productive range. The results showed that adjusting our focus to a RAS range of 9.1 to 9.8 led to an even more significant outcome. This refined range demonstrated an 11.7% higher top 10 appearance rate compared to the bottom 10. Therefore, this will be the subject of this study going forward.
Due to these findings, RAS could play a small factor in our Star-Predictor Score (SPS) model. Since 1.30 RAS is the lowest seen since 2003 in the top 10, this will be the critical value for the SPS. The Star-Predictor Score (SPS) is a scouting tool designed to maximize investment potential and reduce risks when drafting rookies in Fantasy Football. It is proven to have a higher accuracy than draft capital alone to predict fantasy success. The SPS includes 13 to 17 metrics, with the exact number varying by the player’s position. All these metrics are pre-NFL, and some are invented by us, providing a complete analysis of a player’s analytical profiles. The SPS gained widespread notoriety for its high accuracy, having made it on Barstool and The Pat McAfee Show. The SPS can be found here.
Using standard statistical methods, we investigated the correlation between a DB’s RAS and their fantasy production. These findings can be seen below:
Surprisingly, these values suggest no significant correlation between a DB’s RAS and their fantasy output. We are hoping for a minimum of 0.1, or an inverse correlation maximum of -0.1 when we study world-class athletes as we are. For reference to something that everyone acknowledges matters in prospect scouting, and to show the accompanying Pearson value, QB draft capital prevailed a -0.219 Pearson value.
Further analysis included examining how relevant these RAS values are over decades. Our decadal differences chart uncovered an important trend: RAS’s impact has diminished in recent years, particularly in mid-range finishers. This insight will further temper the weight of RAS in our SPS model.
| 2004-2013 | |||
| Top 10 | 11 through 40 | Bottom 10 | |
| All count | 72 | 232 | 71 |
| All 9.1 to 9.8 RAS | 24 | 75 | 13 |
| % (Optimal Range/all) | 33.3% | 32.3% | 18.3% |
| 2014-2023 | |||
| Top 10 | 11 through 40 | Bottom 10 | |
| All count | 94 | 274 | 89 |
| All 9.1 to 9.8 RAS | 27 | 51 | 17 |
| % (Optimal Range/all) | 28.7% | 18.6% | 19.1% |
*Predict the 2026 Super Bowl winner on the product page for a full refund! No catches or extra fees to participate!* What 3 metrics matter the most when scouting a rookie Quarterback? What threshold should Quarterbacks achieve within those metrics to be considered an elite prospect? How much should you value those stats above all other stats? Couldn't answer those questions? Rest easy, we have it handled for you. That's what this chart answers. Sort by importance and/or filter by position. Unlock by signing up with the links provided. $9.99/Year or $24.99 Lifetime access. Cancel anytime.
While our study revealed insights, it did not uncover groundbreaking correlations between RAS and fantasy success. Our findings found that Defensive Backs with a RAS between 9.1 and 9.8 prevailed the most consistent top-level performance in the NFL. Although, there was no regression testing support.
Our series has always sought to push the boundaries of sports analytics. This latest installment reaffirms our commitment to uncovering the hidden dynamics that define the game. Every Saturday, we’ll dive into intriguing questions, bust myths, and settle debates with thorough analysis. We welcome your input. Therefore, please leave comments or reach out with topics you’re eager to see dissected. Premium Analytics subscribers get priority. All of our research can be found on our Analytics Page. Up next on our agenda for Part 32 of “Does It Matter?” we will be finding an average Running Backs touches at career decline. What is it going to be? Mark your calendars; every Saturday we shed light on the topics that matter to you.


BrainyBallers Buy-Hold-Sell Chart (All Players)
Get Your Order 100% Refunded By Predicting The Next SuperBowl Winner!
For our 61 part “Does It Matter?” series, we looked into whether a Wide Receiver’s College Yards After Catch per Reception (YAC/Rec)

In part 60 of our “Does It Matter?” series, we dove into the question of whether a college Wide Receiver’s career Average

The “Does It Matter?” series, part 59 looked to uncover the role of a quarterback’s rookie touchdown per game (TD/G) in predicting
