
Tight Ends: Can College Yardage Help Predict NFL Success?
When evaluating talent for the NFL, analysts often look at a player’s college performance to predict their professional success. In our 64-part


For part 35 of our “Does It Matter?” series, we attempted to find whether a linebacker’s 40-yard dash time can predict their success in fantasy football. From looking into our data, we found an optimal range you should look for at the NFL Combine. Here is the breakdown of all our findings:
For our analysis, we examined the top 50 fantasy football finishers since 2003. Throughout this study, you will see the term “bottom 10”, which is defined as leaderboard finishers ranked from 41st to 50th each season.
Why the top 50? The decision to analyze the top 50 allowed us to maintain a “happy medium.” Examining players further down the leaderboards would be looking at fringe roster players, potentially only skewing our data given their unlikelihood to rank in the top 10. Conversely, going as far down as 50 allowed us to compare the best to the worst still.
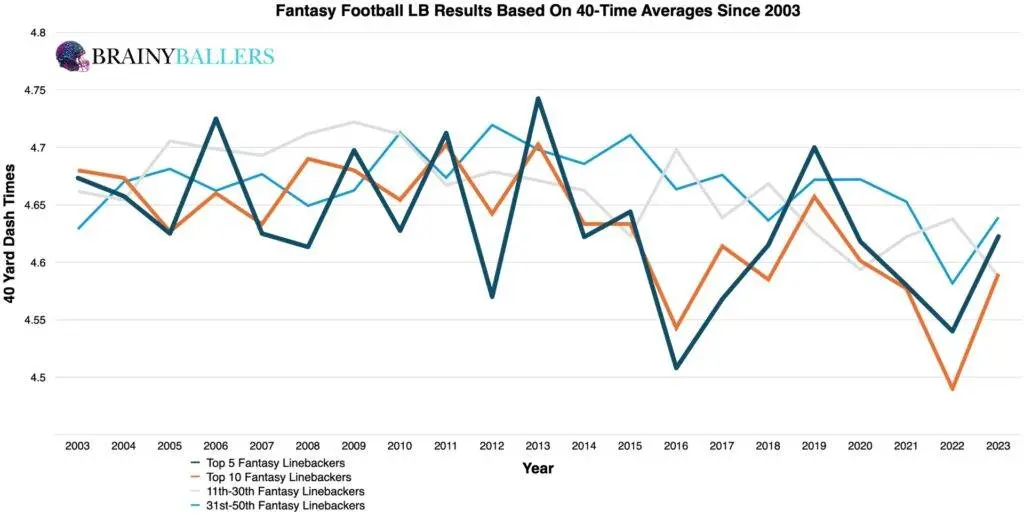
To begin our study, our averages chart categorized finishers into 4 different groups: Top 5, Top 10, 11th-30th, and 31st-50th places. From this, it is seen that 15 out of 21 seasons (71.4%), the Top 10 performers had the same or lower 40-times compared to the 31st-50th finishers. This implies a subtle trend that lower 40-times align with higher fantasy football scores more times than not.
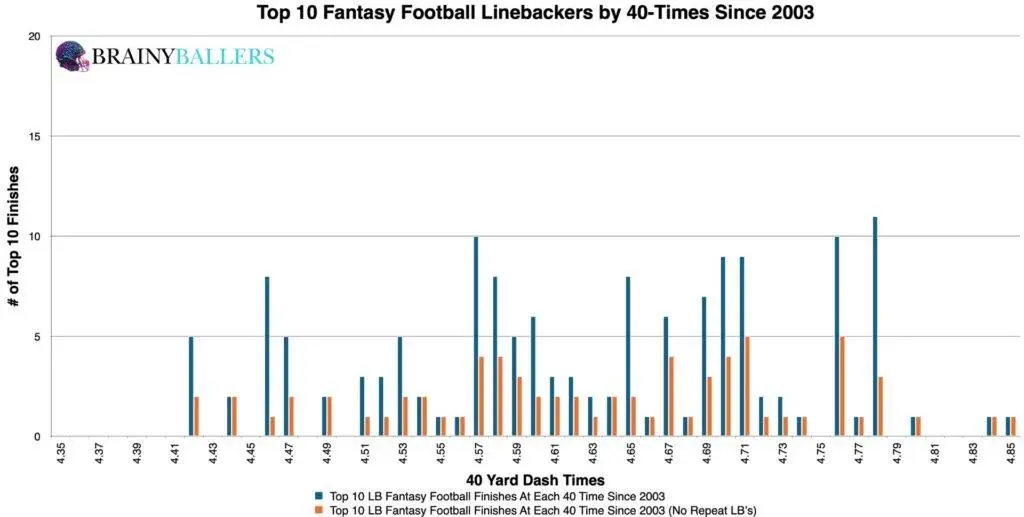
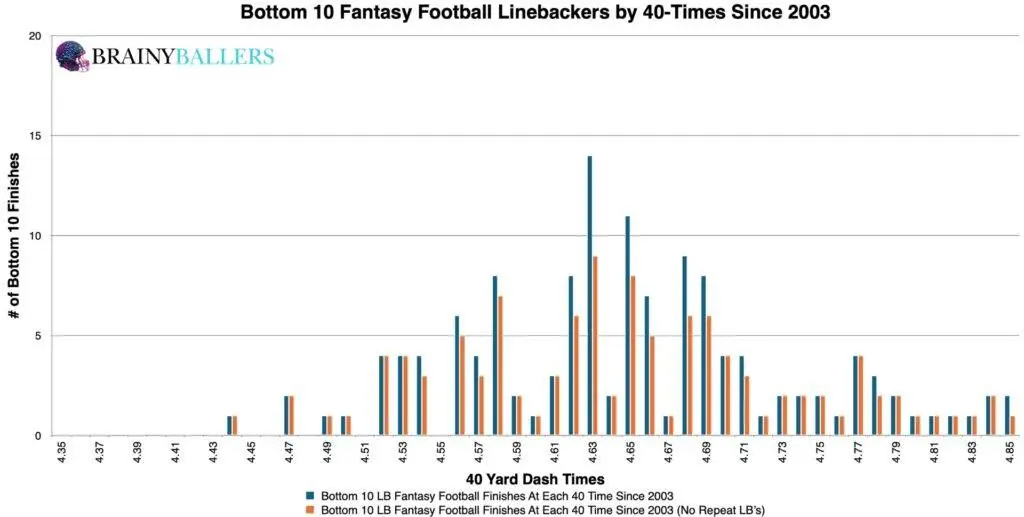
We also segmented the top and bottom 10 finishers’ 40-times into 0.01-second increments. For this analysis, it was difficult to see exactly where the top 10 contrasted from the bottom 10. Typically, it is relatively easy to identify how the weight of the top 10 chart is different than the bottom 10, which you can’t easily decipher here.
In the pursuit of identifying an applicable threshold linking 40-yard dash times to NFL success, we created a differences chart to compare individual 40-times plus the next 0.05 seconds, subtracting the bottom 10 results from the top 10. The chart’s desired outcome is a negative number for unique differences (Orange) and a positive number for non-unique differences (Blue). This would indicate the desired consistent top level consistency we are hoping for. Through this chart, it appeared as though 4.62 seconds and below was a potential threshold for top performances. We will next attempt to verify this by applying this to all top and bottom 10 finishers since 2003.
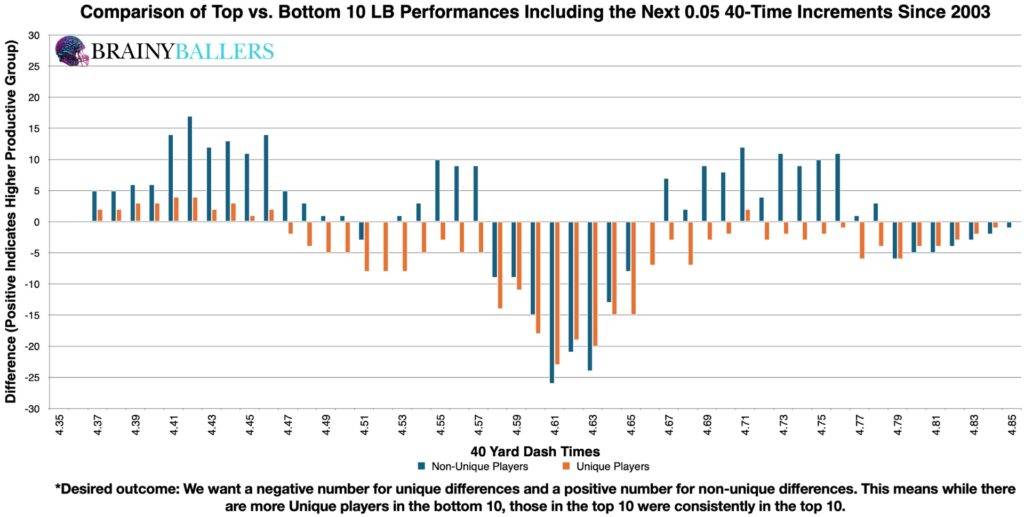
By testing the above mentioned range and altering it to different nearby ranges and thresholds, it was revealed that 4.60 seconds and below prevailed the highest producing optimal range, producing a 17.5% higher top 10 appearance rate than those in the bottom 10. Therefore, this will be our optimal range for Linebacker 40 Yard Dash Times, and will be the subject of this research going forward.
Due to these findings, 40-times could play a factor in our Star-Predictor Score (SPS) model. Since 5.00 seconds is the highest seen since 2003 in the top 10, this will be the critical value for the SPS. The Star-Predictor Score (SPS) is a scouting tool designed to maximize investment potential and reduce risks when drafting rookies in Fantasy Football. It is proven to have a higher accuracy than draft capital alone to predict fantasy success. The SPS includes 13 to 17 metrics, with the exact number varying by the player’s position. All these metrics are pre-NFL, and some are invented by us, providing a complete analysis of a player’s analytical profiles. The SPS gained widespread notoriety for its high accuracy, having made it on Barstool and The Pat McAfee Show. The SPS can be found here.
Utilizing standard statistical methods, our data returned a Pearson value of -0.125. This indicates a negative, but strong, correlation between a linebacker’s 40-time and overall fantasy production, reinforcing the idea that lower 40-times produce higher fantasy football success. We are hoping for a minimum of 0.1, or an inverse correlation maximum of -0.1 when we study world-class athletes as we are. For reference to something that everyone acknowledges matters in prospect scouting, and to show the accompanying Pearson value, QB draft capital prevailed a -0.219 Pearson value.
By examining our optimal range across decades, we were able to contextualize the significance of our identified 40-time range in terms of time significance. These findings suggest the optimal range has more importance in the most recent decade, as you can see below:
| 2004-2013 | |||
| Top 10 | 11 through 40 | Bottom 10 | |
| All count | 67 | 205 | 65 |
| All 4.60 and below | 24 | 37 | 14 |
| % (Optimal Range/all) | 35.8% | 18.0% | 21.5% |
| 2014-2023 | |||
| Top 10 | 11 through 40 | Bottom 10 | |
| All count | 77 | 236 | 74 |
| All 4.60 and below | 41 | 82 | 22 |
| % (Optimal Range/all) | 53.2% | 34.7% | 29.7% |
What 3 metrics matter the most when scouting a rookie Quarterback? What threshold should Quarterbacks achieve within those metrics to be considered an elite prospect? How much should you value those stats above all other stats? Couldn't answer those questions? Rest easy, we have it handled for you. That's what this chart answers. Sort by importance and/or filter by position. Unlock by signing up with the links provided. $9.99/Year or $24.99 Lifetime access. Cancel anytime.
Speed may not be the sole predictor of NFL success. Although, our research suggests a clear relationship between faster 40-times and higher fantasy football finishes. The optimal range for Linebacker 40-yard dash times is 4.60 seconds and below, resulting in a 17.5% higher top 10 appearance rate than in the bottom 10.
Our series has always sought to push the boundaries of sports analytics. This latest installment reaffirms our commitment to uncovering the hidden dynamics that define the game. Every Saturday, we’ll dive into intriguing questions, bust myths, and settle debates with thorough analysis. We welcome your input. Therefore, please leave comments or reach out with topics you’re eager to see dissected. Premium Analytics subscribers get priority. All of our research can be found on our Analytics Page. Up next on our agenda for Part 36 of “Does It Matter?” will be an examination of Linebacker RAS (Relative Athletic Score): Does it matter? If so, what’s the RAS threshold necessary for NFL success? Mark your calendars; every Saturday we shed light on the topics that matter to you.


BrainyBallers Buy-Hold-Sell Chart (All Players)
Get Your Order 100% Refunded By Predicting The Next SuperBowl Winner!
When evaluating talent for the NFL, analysts often look at a player’s college performance to predict their professional success. In our 64-part

In our 63-part analytical series, “Does It Matter?”, we next wanted to look into the intriguing question of whether a Tight End’s

For our 61 part “Does It Matter?” series, we looked into whether a Wide Receiver’s College Yards After Catch per Reception (YAC/Rec)
