
Tight Ends: Can College Yardage Help Predict NFL Success?
When evaluating talent for the NFL, analysts often look at a player’s college performance to predict their professional success. In our 64-part


For our 61 part “Does It Matter?” series, we looked into whether a Wide Receiver’s College Yards After Catch per Reception (YAC/Rec) can be a predictor of their future success in the NFL. This analysis is particularly helpful for making decisions between two players, though it should not be considered a definitive guide for determining a player’s success or bust potential. Here is all of our methodology and findings.
To structure our study, we analyzed the top 50 PPR (Point Per Reception) fantasy football finishers from each season since 2016. The term “bottom 10″, which you will see throughout this study, is used to refer to players who finished in the 41st-50th positions each season. Our data source was Pro Football Focus (PFF).
Why the top 50? Limiting our research to the top 50 annually provided a balance between avoiding the fringe roster players who could only skew our data while still effectively comparing the best to the worst performers. This allows us to more accurately gauge the potential impact of YAC/Rec on NFL success without skewed results.
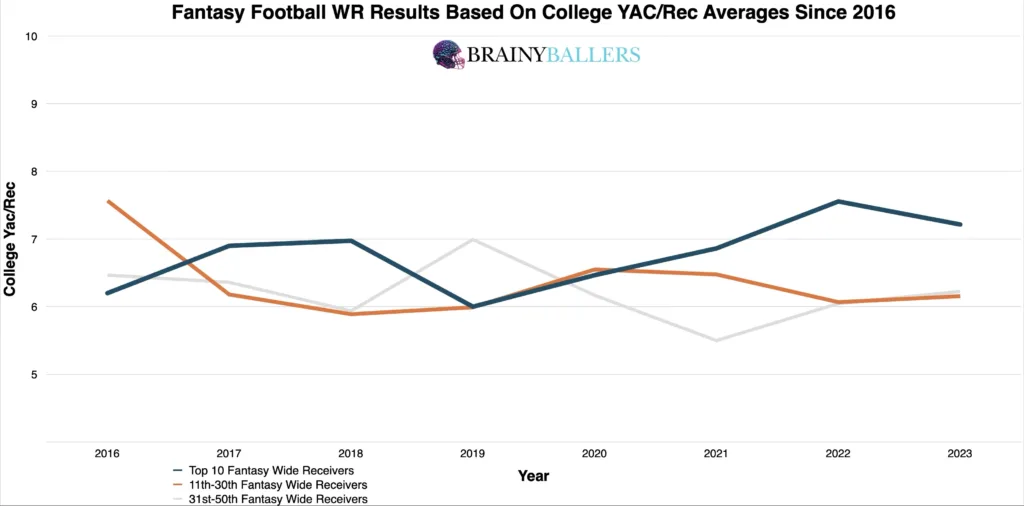
To begin our study, an averages chart was created looking at the average college career YAC/Rec amongst the top 5, 10, 11-30th, and 31-50th place finishers’ averages since 2016. The data revealed the following pattern: in 6 out of 8 seasons analyzed (75%), the top 10 fantasy finishers had higher college career YAC/Rec than those in the 31st-50th positions.
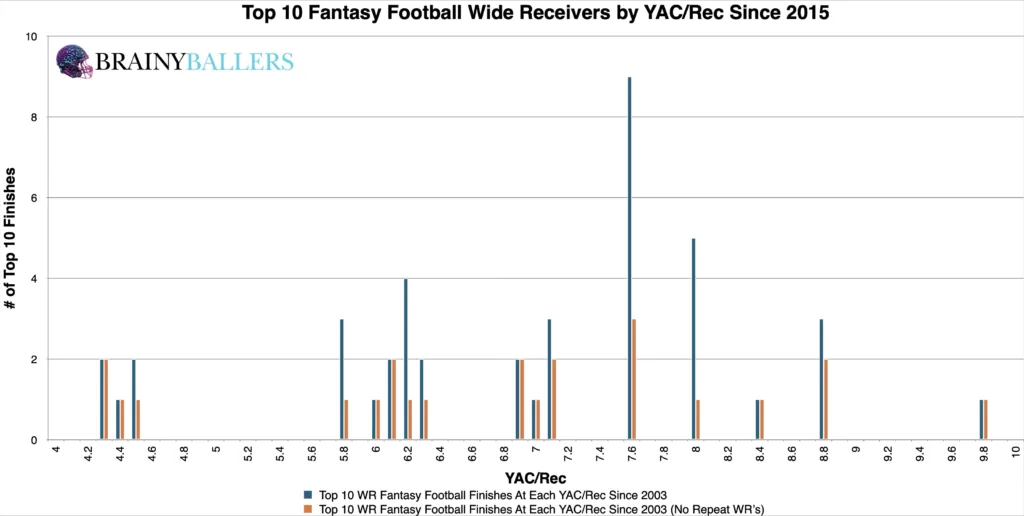
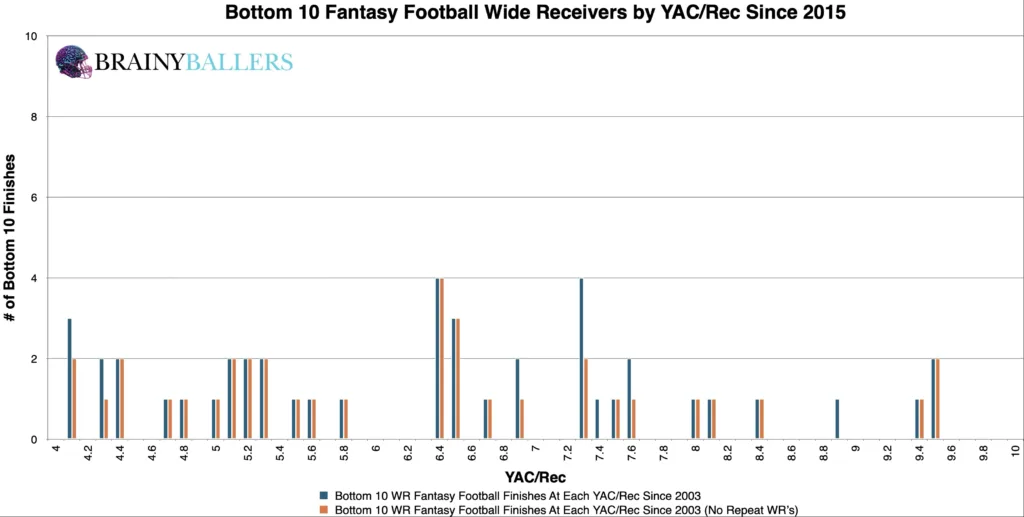
Our next approach was to plot out the top and bottom 10 finishers since 2016 segmented into 0.1 YAC/Rec intervals. The data from these charts also indicated that higher YAC/Rec typically corresponded to higher fantasy football success. Weight and distribution differences of these charts is how that insight was derived.
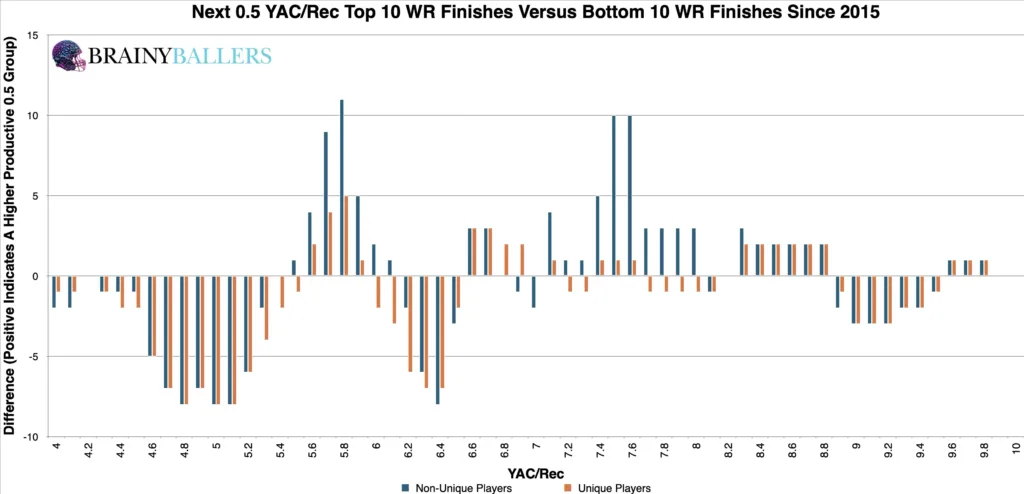
To establish an applicable threshold, we created a differences chart. This chart compares each YAC/Rec value plus the next 0.5 YAC/Rec grouping, subtracting the bottom 10 performers from the top 10. The chart’s desired outcome is a negative number for unique differences (Orange) and a positive number for non-unique differences (Blue). This would indicate the top level consistency we are hoping for. The insights from this chart suggested that a YAC/Rec of either 5.5 or 6.6 and above indicated top performance potential, which we will attempt to verify either of those next as the top producing threshold.
By making quick range adjustments within our spreadsheet, we were able to find the top producing threshold. By testing various numbers close to our differences chart’s suggested range, we discovered that adjusting to a college career YAC/Rec of 5.7 and above yields a notable 31.6% higher top 10 appearance rate compared to the bottom 10 finishers. This range is what you should hope for in your favorite Wide Receiver prospects and will be our optimal range for Wide Receivers for our SPS system. We are hoping to have this model fully functional by the beginning of the 2026 NFL season.
Due to these findings, YAC/Rec could play a factor in our Star-Predictor Score (SPS) model. The Star-Predictor Score (SPS) is a scouting tool designed to maximize investment potential and reduce risks when drafting rookies in Fantasy Football. It is proven to have a higher accuracy than draft capital alone to predict fantasy success. The SPS includes 13 to 17 metrics, with the exact number varying by the player’s position. All these metrics are pre-NFL, and some are invented by us, providing a complete analysis of a player’s analytical profiles. The SPS gained widespread notoriety for its high accuracy, having made it on Barstool and The Pat McAfee Show. The SPS can be found here.
Next, we looked into standard statistical analysis methods to further validate or debunk our findings. Below are the results when comparing college YAC/Rec to the players corresponding fantasy points every season:
This suggests a strong correlation between a WR’s college career Yards after catch per reception and their future fantasy production. We are hoping for a minimum of 0.1, or an inverse correlation maximum of -0.1 when we study world-class athletes as we are. For reference to something that everyone acknowledges matters in prospect scouting, and to show the accompanying Pearson value, QB draft capital prevailed a -0.219 Pearson value.
What 3 metrics matter the most when scouting a rookie Quarterback? What threshold should Quarterbacks achieve within those metrics to be considered an elite prospect? How much should you value those stats above all other stats? Couldn't answer those questions? Rest easy, we have it handled for you. That's what this chart answers. Sort by importance and/or filter by position. Unlock by signing up with the links provided. $9.99/Year or $24.99 Lifetime access. Cancel anytime.
Our analysis revealed that 5.7 yards after catch per reception and above is the desired threshold which holds predictive value for NFL success. Though this should not be seen as a stat people use on a standalone basis to determine future success, it it definitely can be used for determining NFL success.
Our series has always sought to push the boundaries of sports analytics. This latest installment reaffirms our commitment to uncovering the hidden dynamics that define the game. Every Saturday, we’ll dive into intriguing questions, bust myths, and settle debates with thorough analysis. We welcome your input. Therefore, please leave comments or reach out with topics you’re eager to see dissected. All of our research can be found on our Analytics Page. Up next on our agenda for Part 62 of “Does It Matter?” is an examination of Wide Receiver RAS: Does it matter? If so, what’s the YAC/Rec threshold necessary for NFL success? Mark your calendars; every Saturday we shed light on the topics that matter to you.


When evaluating talent for the NFL, analysts often look at a player’s college performance to predict their professional success. In our 64-part

In our 63-part analytical series, “Does It Matter?”, we next wanted to look into the intriguing question of whether a Tight End’s

In part 60 of our “Does It Matter?” series, we dove into the question of whether a college Wide Receiver’s career Average
