
Tight Ends: Can College Yardage Help Predict NFL Success?
When evaluating talent for the NFL, analysts often look at a player’s college performance to predict their professional success. In our 64-part


For the 38th installment in our “Does It Matter?” series, we looked into defensive ends to explore whether their height plays a role in predicting their NFL success. Using our data, we found an optimal range for Defensive End heights and found a Pearson value to find standard statistical correlation. Here are all our findings:
Our research began by scrutinizing the top 50 fantasy football finishers annually since 2003. In this article, you will see the term “bottom 10”, which refers to players who finished between the 41st and 50th place each season. All of our height data was sourced from the NFL Draft Combine, consistency.
Why the top 50? Selecting the top 50 was a strategy we employed to have a “happy medium.” This balances the possibility of skewing the data with fringe roster players who perform lower than the top 50 and naturally won’t finish in the top 10. On the other hand, we wanted to truly compare the best to the worst, which is the reason for the gap between the top 10 and what we defined as the bottom 10 (41st and 50th place).
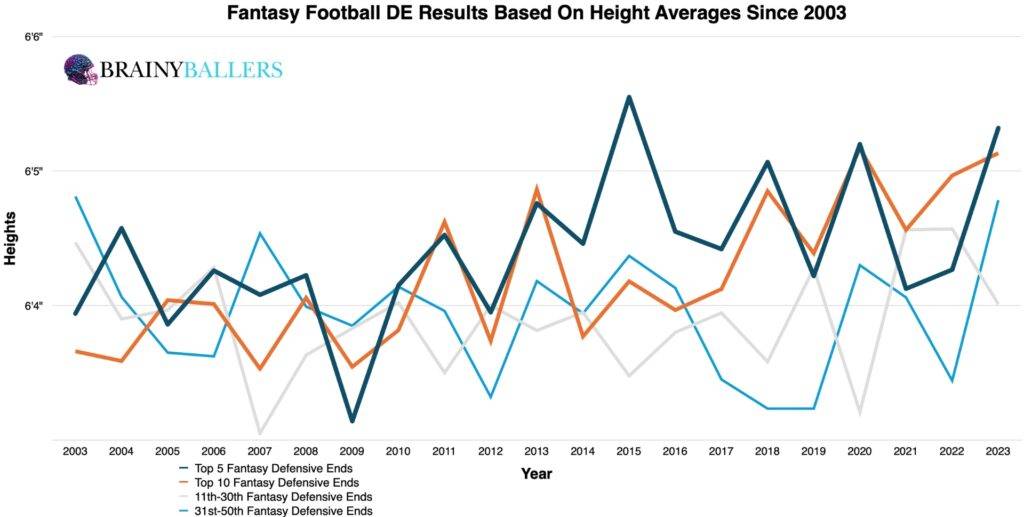
To visualize possible trends, we created an averages chart. This broke down leaderboards into top 5, top 10, 11th-30th, and 31st-50th place finishers’ averages since 2003. The findings were obvious: 18 of the last 21 seasons (85.7%), players finishing in the top 5 had the same, or greater, height averages compared to those in the “bottom 10.” This suggested a potential correlation between height and NFL success.
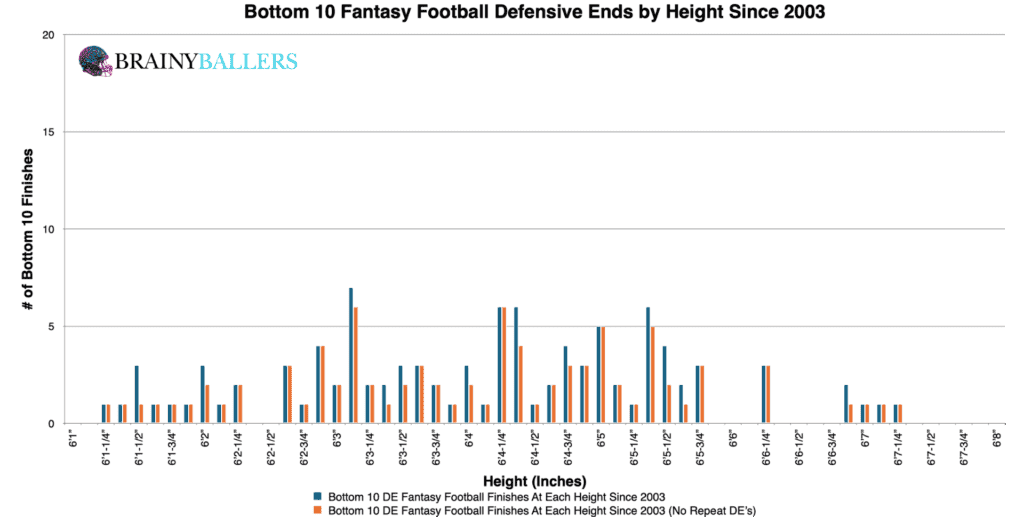
We segmented the top and bottom 10 finishers into 0.125-inch increments to see the full breakdown of where players were. This chart revealed that the top 10 was mainly weighted towards greater height when compared to the bottom 10. Those charts can be seen below:
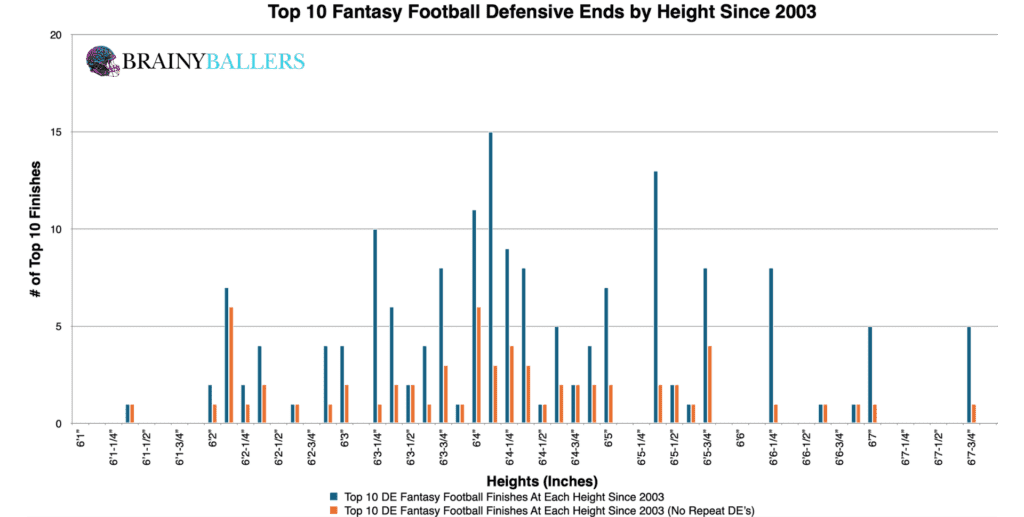
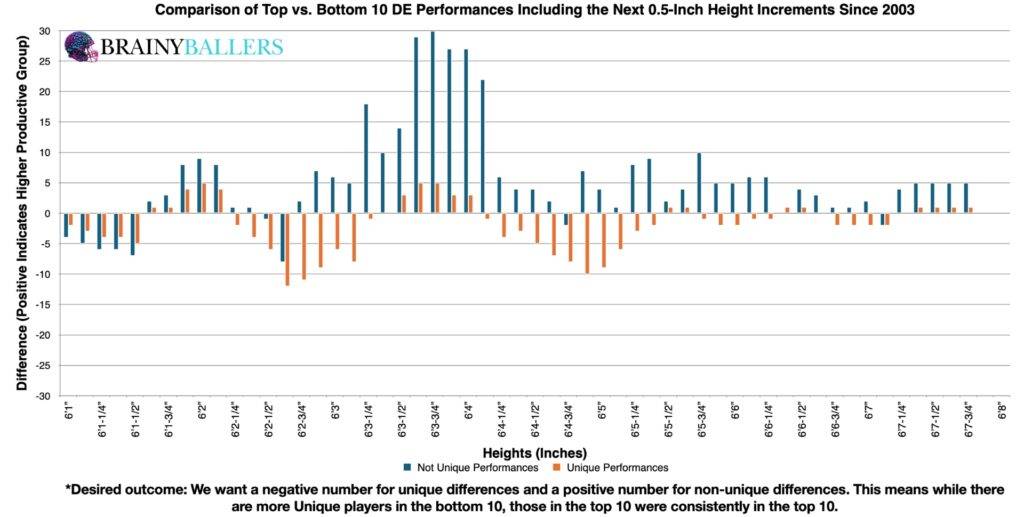
Next, we created a differences chart that compared each top 10 height against the bottom 10, including the next 0.5 inches at each indicated increment. This method was an attempt to identify a height range where the highest increase in performances occurred. The chart’s desired outcome is a negative number for unique differences (Orange) and a positive number for non-unique differences (Blue). This analysis revealed that the height range between 6’3-1/4” and 6’4-5/8” was a possible optimal range. If you are curious why the differences chart is all positive, this was due to a data imbalance: 168 top 10 finishers have height data, compared to just 104 in the bottom 10, based on NFL Combine records. We next will attempt to verify this as the optimal range, or find a close one that prevails a higher producing one.
After several adjustments in our spreadsheet, this range emerged as the highest producer. We test both the top end of this range and the bottom. We found that this range produced a 16.8% greater top 10 presence than the bottom 10 finishers. Therefore, 6’3-1/4” to 6’4-5/8” is our optimal range for DE Heights and will be this study’s subject going forward.
Due to these findings, height could play a factor in our Star-Predictor Score (SPS) model. Since 5’11-5/8” is the lowest seen since 2003 in the top 10, this will be the critical value for the SPS. The Star-Predictor Score (SPS) is a scouting tool designed to maximize investment potential and reduce risks when drafting rookies in Fantasy Football. It is proven to have a higher accuracy than draft capital alone to predict fantasy success. The SPS includes 13 to 17 metrics, with the exact number varying by the player’s position. All these metrics are pre-NFL, and some are invented by us, providing a complete analysis of a player’s analytical profiles. The SPS gained widespread notoriety for its high accuracy, having made it on Barstool and The Pat McAfee Show. The SPS can be found here.
The Pearson correlation value, calculated at 0.087, indicated no significant correlation between a defensive end’s height and their fantasy production. We are hoping for a minimum of 0.1, or an inverse correlation maximum of -0.1 when we study world-class athletes as we are. For reference to something that everyone acknowledges matters in prospect scouting, and to show the accompanying Pearson value, QB draft capital prevailed a -0.219 Pearson value.
To reveal whether this is an emerging or dying trend, we extended our analysis to analyze this optimal range across the last 2 decades. The decadal differences chart showed this height range as an emerging trend among top performers, suggesting its increasing relevance in the NFL.
| 2004-2013 | |||
| Top 10 | 11 through 40 | Bottom 10 | |
| All count | 83 | 185 | 49 |
| All Between 6’3-1/4 and 6’4-5/8” | 43 | 73 | 19 |
| % (Optimal Range/all) | 51.8% | 39.5% | 38.8% |
| 2014-2023 | |||
| Top 10 | 11 through 40 | Bottom 10 | |
| All count | 77 | 164 | 51 |
| All Between 6’3-1/4 and 6’4-5/8” | 33 | 52 | 11 |
| % (Optimal Range/all) | 42.9% | 31.7% | 21.6% |
What 3 metrics matter the most when scouting a rookie Quarterback? What threshold should Quarterbacks achieve within those metrics to be considered an elite prospect? How much should you value those stats above all other stats? Couldn't answer those questions? Rest easy, we have it handled for you. That's what this chart answers. Sort by importance and/or filter by position. Unlock by signing up with the links provided. $9.99/Year or $24.99 Lifetime access. Cancel anytime.
Height alone clearly doesn’t guarantee success. Through our analysis, we identified 6’3-1/4” to 6’4-5/8” as the optimal height range that helps, but doesn’t enable success enough to say it matters. Traditional statistical methods proved that, meaning height shouldn’t be a main priority in scouting Defensive Ends.
Our series has always sought to push the boundaries of sports analytics. This latest installment reaffirms our commitment to uncovering the hidden dynamics that define the game. Every Saturday, we’ll dive into intriguing questions, bust myths, and settle debates with thorough analysis. We welcome your input. Therefore, please leave comments or reach out with topics you’re eager to see dissected. All of our research can be found on our Analytics Page. Up next on our agenda for Part 39 of “Does It Matter?” is an examination of Defensive End Weight: Does it matter? If so, what’s the weight threshold necessary for NFL success? Mark your calendars; every Saturday we shed light on the topics that matter to you. All it takes is a quick question being asked and we will go to work for you!


BrainyBallers Buy-Hold-Sell Chart (All Players)
Get Your Products 100% Refunded By Predicting The Next SuperBowl Winner!
When evaluating talent for the NFL, analysts often look at a player’s college performance to predict their professional success. In our 64-part

In our 63-part analytical series, “Does It Matter?”, we next wanted to look into the intriguing question of whether a Tight End’s

For our 61 part “Does It Matter?” series, we looked into whether a Wide Receiver’s College Yards After Catch per Reception (YAC/Rec)
