
Tight Ends: Can College Yardage Help Predict NFL Success?
When evaluating talent for the NFL, analysts often look at a player’s college performance to predict their professional success. In our 64-part


In part 41 of our “Does It Matter?” series, we looked to answer the question of whether the Relative Athletic Score (RAS) of Defensive Ends can predict their success in the NFL. This analysis is especially useful for choosing between two players or coming to a conclusion on one specific player, but it shouldn’t be seen as a conclusive predictor of a player’s success or failure potential. We’ve crunched the numbers and analyzed our data from the top 50 fantasy football finishers since 2003. From this, we found an optimal range which you can look for in athletes. Here’s a breakdown of all our findings.
Relative Athletic Score (RAS) is a metric used to evaluate the athleticism of NFL prospects based on their performances in Combine and Pro Day drills. Developed by Kent Lee Platte in 2013, RAS takes various physical attributes such as speed, agility, explosiveness, and size to normalize them on a scale from 0 to 10. The results are then color-coded to provide a quick visual comparison of a player’s athletic traits relative to other players of the same position. This system helps teams and analysts quickly assess the athletic potential of prospects. Us at BrainyBallers have used RAS religiously in evaluating talents.
To answer our primary question, we chose the top 50 fantasy football finishers each season since 2003. For clarification, the “bottom 10”, or “B10”, refers to those finishing between 41st and 50th place each season. For our data, we excluded anyone who had a defensive tackle label.
Why the top 50? Choosing the top 50 allowed us to achieve what we call a “happy medium”. Extending beyond this would include fringe roster players who are unlikely to enter the top 10 and therefore would only skew the data. Although, by focusing on the top and bottom 10, we can truly compare the best to the worst.
We developed an averages chart which highlights the average RAS of finishers in the top 5, 10, 11th-30th, and 31st-50th places. Over the 21-year dataset (2003-2023) in this chart, we found no trends. In 47.6% of the seasons, the top 5 players recorded equal or lower RAS compared to those finishing 31st-50th.
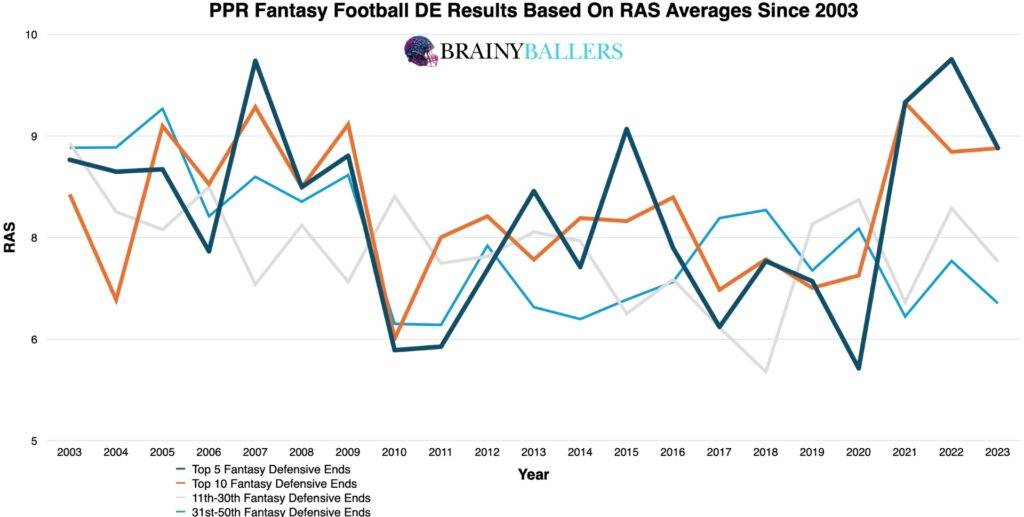
More interesting findings came when we segmented the top 10 finishers into 0.1 RAS increments. Here, the data skewed towards higher RAS scores in the top 10 versus the bottom 10. This indicates potential predictive potential in these ranges. You can see both of those charts next, with the top 10 coming first:
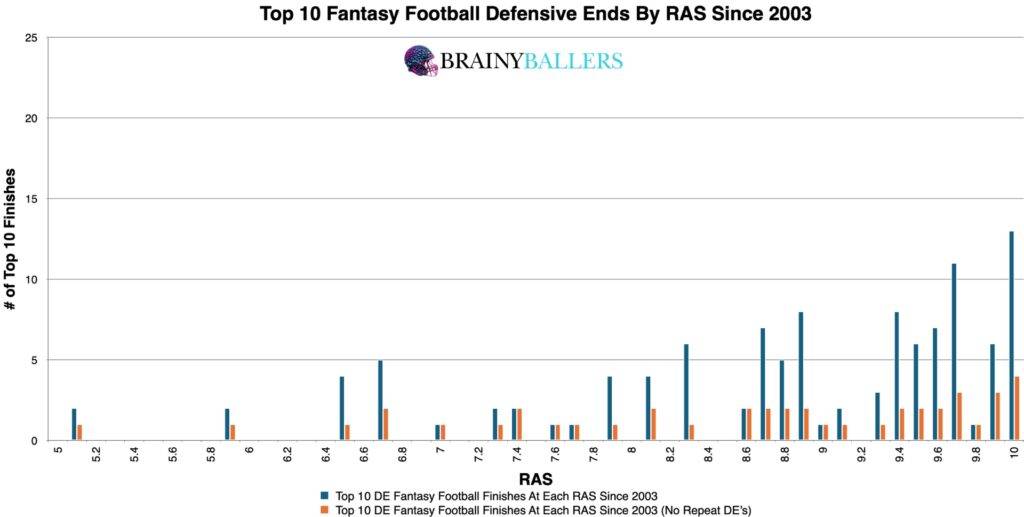
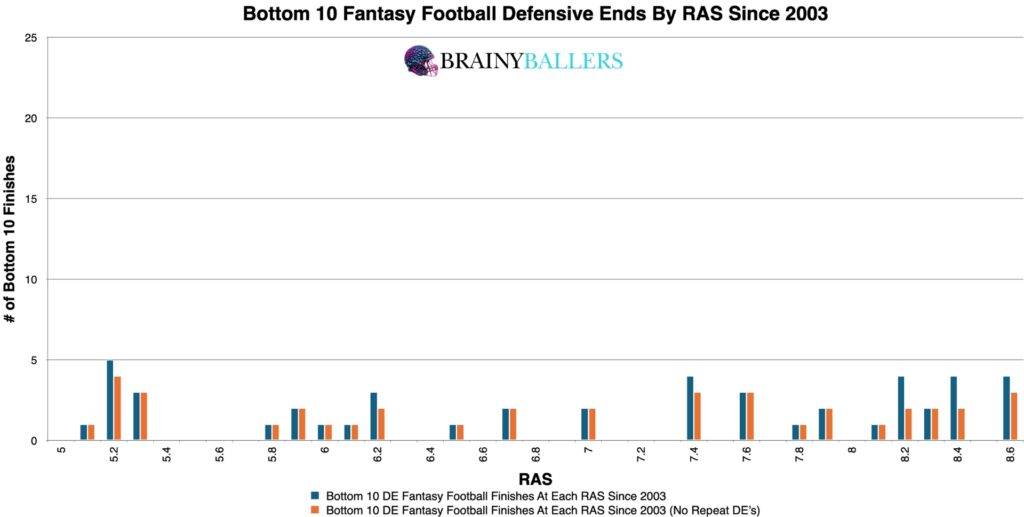
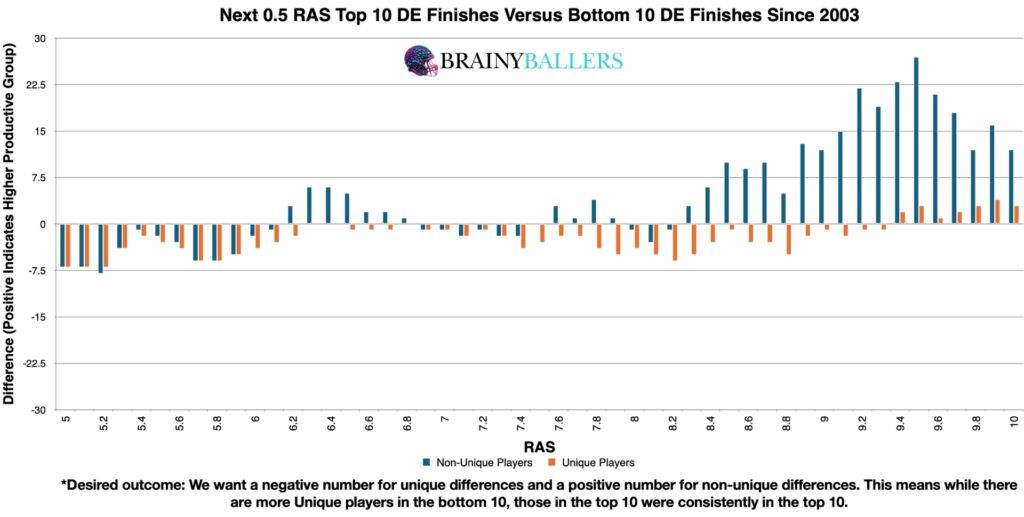
Our goal was to pinpoint a range that occurs the most in the top 10 versus the bottom 10 while also being aware of the one-hit wonders of the league. To achieve this, we created our differences chart. The chart’s desired outcome is a negative number for unique differences (Orange) and a positive number for non-unique differences (Blue). This would indicate the top level consistency we are hoping for.
By comparing each RAS score, plus the next 0.5 RAS, and subtracting the bottom 10 results from the top 10, we seen an obvious pattern. A RAS of 8.3 and above appeared to be a high-performance threshold, bringing us closer to identifying the optimal range. It is worthwhile to note that the reason this chart was mainly positive was due to an imbalance of RAS available for the top 10 versus the bottom 10 since 2003. Even though there is an imbalance, it is the appearance rate of a range we are trying to hone in on. therefore, we will next attempt to verify 8.3 and above as the top-producing range.
To verify this range, we utilized our spreadsheet to alter this threshold to various ones to attempt to find a better producing one. Testing various numbers in proximity to our initial findings did lead to a higher producing range. We discovered that setting our threshold at 8.7 RAS and above resulted in a 20.2% increase in top 10 appearances compared to the bottom 10. Thus, this range will be a subject in of this research going forward.
Due to these findings, RAS could play a factor in our Star-Predictor Score (SPS) model. Since 2.73 RAS is the lowest seen since 2003 in the top 10, this will be the critical value for the SPS. The Star-Predictor Score (SPS) is a scouting tool designed to maximize investment potential and reduce risks when drafting rookies in Fantasy Football. It is proven to have a higher accuracy than draft capital alone to predict fantasy success. The SPS includes 13 to 17 metrics, with the exact number varying by the player’s position. All these metrics are pre-NFL, and some are invented by us, providing a complete analysis of a player’s analytical profiles. The SPS gained widespread notoriety for its high accuracy, having made it on Barstool and The Pat McAfee Show. The SPS can be found here.
While examining our data using standard statistical methods, the Pearson value came back as 0.083. This shows no significant correlation between a DE’s RAS and their fantasy output using standard methods. We are hoping for a minimum of 0.1, or an inverse correlation maximum of -0.1 when we study world-class athletes as we are. For reference to something that everyone acknowledges matters in prospect scouting, and to show the accompanying Pearson value, QB draft capital prevailed a -0.219 Pearson value.
We further broke down our optimal range across decade, comparing the impact of it on the top 10, 11th-40th place finishers, and bottom 10. The decadal differences chart revealed that the optimal range we pinpointed is consistently significant over time, as you can see below:
| 2004-2013 | |||
| Top 10 | 11 through 40 | Bottom 10 | |
| All count | 63 | 154 | 40 |
| All 8.7 and above | 38 | 70 | 15 |
| % (Optimal Range/all) | 60.3% | 45.5% | 37.5% |
| 2014-2023 | |||
| Top 10 | 11 through 40 | Bottom 10 | |
| All count | 74 | 156 | 52 |
| All 8.7 and above | 37 | 50 | 15 |
| % (Optimal Range/all) | 50.0% | 32.1% | 28.8% |
What 3 metrics matter the most when scouting a rookie Quarterback? What threshold should Quarterbacks achieve within those metrics to be considered an elite prospect? How much should you value those stats above all other stats? Couldn't answer those questions? Rest easy, we have it handled for you. That's what this chart answers. Sort by importance and/or filter by position. Unlock by signing up with the links provided. $9.99/Year or $24.99 Lifetime access. Cancel anytime.
Through our analysis on DE RAS, we were able to pinpoint an optimal range. While RAS is not a sole determinant of NFL success, it apparently does have some influence if success. 8.7 and above RAS is the optimal range, but without standard statistical support it is hard to validate RAS as a reliable indicator of fantasy football success by itself.
Our series has always sought to push the boundaries of sports analytics. This latest installment reaffirms our commitment to uncovering the hidden dynamics that define the game. Every Saturday, we’ll dive into intriguing questions, bust myths, and settle debates with thorough analysis. We welcome your input. Therefore, please leave comments or reach out with topics you’re eager to see dissected. All of our research can be found on our Analytics Page. Up next on our agenda for Part 42 of “Does It Matter?” is an examination of Wide Receiver Draft Capital: Does it matter? If so, what’s the Overall threshold necessary for NFL success? Mark your calendars; every Saturday we shed light on the topics that matter to you. All it takes is a quick question being asked and we will go to work for you!


BrainyBallers Buy-Hold-Sell Chart (All Players)
Get Your Products 100% Refunded By Predicting The Next SuperBowl Winner!
When evaluating talent for the NFL, analysts often look at a player’s college performance to predict their professional success. In our 64-part

In our 63-part analytical series, “Does It Matter?”, we next wanted to look into the intriguing question of whether a Tight End’s

For our 61 part “Does It Matter?” series, we looked into whether a Wide Receiver’s College Yards After Catch per Reception (YAC/Rec)
