
Commanders WR Battle 2026: Williams, Burks Chase WR2
Commanders WR battle 2026: rookie Antonio Williams and value bet Treylon Burks chase the WR2 job opposite Terry McLaurin in Jayden Daniels’ offense.


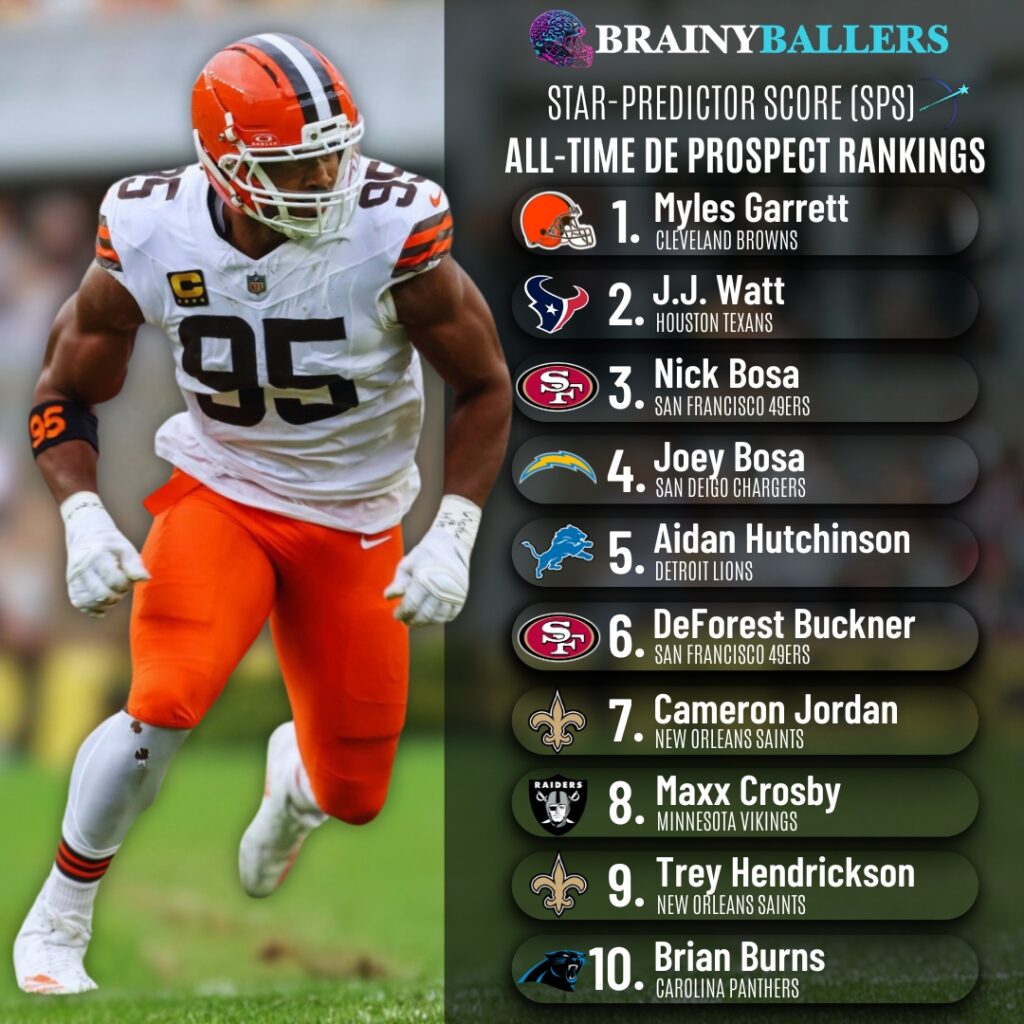
For the 101st part of our “Does It Matter?” series, we looked to find out whether the Star-Predictor Score (SPS), found here, is a reliable indicator of a Defensive End’s future success. Our goal was to uncover the significance of the SPS and establish the ideal benchmark for making informed decisions between prospects or evaluating a single player’s potential. The top 10 DE SPS grades all time currently houses players with a combined 46 pro bowl appearances, 6 DPOY, 12 First Team All-Pros, 800 career sacks, and atleast 1 future first ballot Hall-of-Famer. This article will guide you on how the SPS can help identify undervalued players and verify or challenge the public consensus of star potential in the top NFL Draft picks. Here are all of our findings.
The Star-Predictor Score (SPS) was built as a prospect scouting tool aimed at maximizing investment potential while minimizing risks when drafting rookies in Fantasy Football. Developed using data since 2003, the SPS formula was then applied to every drafted or undrafted free agent (UDFA) since then. From that, and out of a total of 580 Defensive Ends, the following top 10 prevailed:
The analysis you’re about to see regarding how powerful the SPS is first focuses on the top 50 fantasy football finishers each season since 2003, calculated using standard IDP scoring. Then, by comparing coefficients, we evaluated whether SPS or Draft capital offered better predictions for career fantasy points. Terms like “bottom 10”, which you will see throughout this analysis, refers to fantasy finishers ranked 41st to 50th each season since 2003. The Star-Predictor Score (SPS) for Defensive Ends utilizes 17 distinct metrics from various sources to come together into one predictive model. It is presented in a percentile grading system, therefore the top player ever will have a 100.0 SPS grade.
Why the top 50? We did this to accurately compare the DE SPS to all other metrics we’ve researched. Selecting the top 50 provides a “happy medium” approach. Expanding beyond this point would include fringe roster players who are unlikely to rank in the top 10 and could therefore only skew the data. On the other hand, by choosing this range, we create a comparison between the “best” and the “worst”. This is why we chose the 41st to 50th place finishers to contrast against the top 10.
All Defensive End grades refer to Edge rushers specifically, excluding players listed as IDL’s and OLB’s on draft day. Many different sources use various terms for the ‘edge’ position, and we graded only the prospects who were listed as a Defensive End on their NFL draft pick card. This is why JJ Watt – listed as a Defensive End on draft day – is in the DE SPS, but his brother TJ – listed as OLB on draft day – is not. We are thankful for BrainyBallers’ senior film analyst – also from the Run The 9 project – bringing this confusion to our attention as something we should address. You can follow him for extremely thorough and quality film reviews on X here.
Before we get into the analysis, it’s important to note that the SPS excels with predicting the career trajectory of DE’s picked between the 1st and 145th overall pick (end of 4th round). Therefore, our table will mainly only show those players. A higher SPS means higher fantasy success potential.
As far as the 2022 Defensive End class, the DE SPS has Aidan Hutchinson at 90.6 SPS and Travon Walker at 81.4. Aidan has had a much better career despite Travon coming off the draft board before Aidan with the 1st overall pick.
Going back to 2018, the top 3 DE SPS grades were in order of: Nick Bosa, Maxx Crosby, Brian Burns. As far as the 2018 DE class draft order, Bosa was taken 1st, followed by Brain Burns 3rd, then Crosby taken as the 10th DE. Their SPS grades show their underrated value – especially Crosby being taken as the 10th DE but being the 3rd overall DE SPS in that class.
To see the all-time table, you can click here. From those hits alone it’s not hard to see how the SPS has missed less than draft capital, which we will go into further detail within this article.
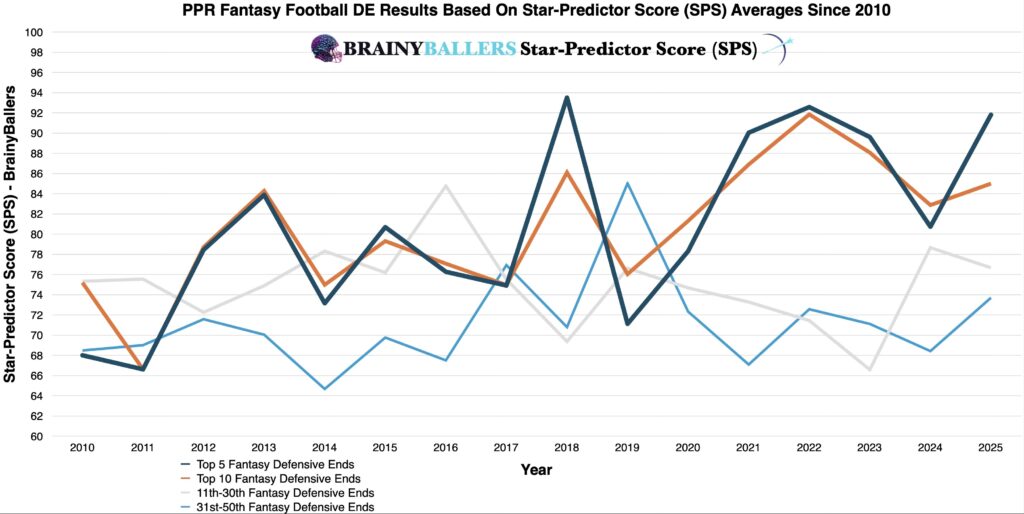
To begin our research, we first wanted to visualize trends by using the averages of the top 5, 10, 11-30th, and 31-50th place finishers’ averages since 2010. From this, a clear and obvious trend was seen: higher average SPS Grades have always yielded higher fantasy scores. In 81.2% of the last 16 seasons, the top 10 finishers boasted higher SPS scores than those ranked 31st to 50th, with an average difference of 14.5 SPS between the top 10 and 31st-50th place finishers each season.
This chart is typically great at indicating correlating metrics, like in the example with defensive end weights where no trend was visible in the averages chart, and weights ended up having zero correlation and therefore shouldn’t be used in scouting defensive ends. As for the SPS, the trend held firm over 16 seasons. 2 of the 3 seasons where the top 10 did not have a better average than the 31st-50th place finishes were due to Myles Garrett’s rookie season and JJ Watt’s pectoral muscle tear season in 2019 where his regular season was cut in half.
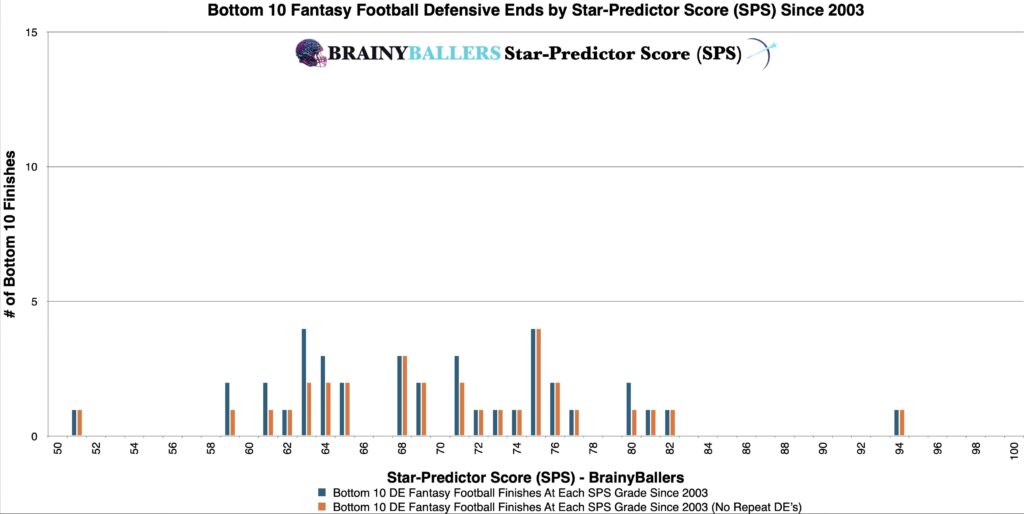
Additionally, we segmented out the top and bottom 10 finishers since 2003 into rounded SPS grades of every 1.0. This further confirmed the correlation between elevated SPS scores and elevated fantasy outcomes. This was evident by evaluating the weight and distribution of both of these charts, where you will see the top 10 chart first:

Our primary goal was to determine the SPS threshold that most consistently predicts top-level performances. We analyzed this by creating a differences chart. This chart compared each SPS score plus the next 3.0 SPS, subtracting the bottom 10 results from the top 10 within each group. The chart’s desired outcome is a negative number for unique differences (Orange) and a positive number for non-unique differences (Blue). This would indicate the top level consistency we are hoping for. From this, it appears as though 69 and above appears to be the top producing range, which we will attempt to verify or fine-tune next.
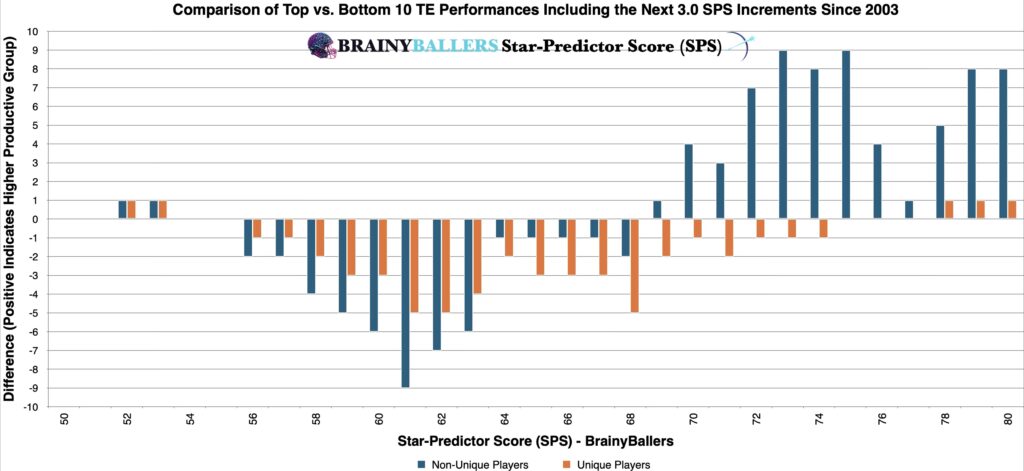
To ensure this is the top producing range, we adjusted the optimal range for testing other ranges. Through testing, we discovered that an SPS of 70.0 and above has a top 10 appearance rate increase of 41.3% compared to the bottom 10. Therefore, this refined range is the future benchmark you should look for in athletes and will be included in our Ultimate Athlete Blueprints, which offers an easy-to-read table housing all of our researched metrics combined in one place for you to view as seen here:

The validity of using the SPS to scout prospects was further confirmed through standard statistical methods. We computed the Pearson Value when relating SPS grades to fantasy points every season since 2003, which can be seen below:
This indicated a great correlation between a DE’s SPS and future fantasy performances. For analyzing world-class athletes as we are, a Pearson value exceeding 0.1 or less than -0.1 is desired. In comparison to other metrics we’ve researched, we’ve researched 55 other stats and metrics for Defensive Ends. The highest we’ve seen thus far in a Pearson value is PlayerProfiler’s Athleticism Score. Athleticism Score prevailed a Pearson value of 0.319. Even draft capital, which showed correlations of -0.257, came in lower than the SPS. This further advocates the predictive ability of the SPS metric in predicting future performance.
For those curious about the correlation coefficient when comparing draft capital and career fantasy points, and then comparing SPS grades to career fantasy points, here it is:
Now going down to all players between the 1st overall through the 4th round NFL Draft picks:
As you can see, the gap of the significance difference closes when going down to the 4th round, although it’s still more predictive. This gap continued to dwindle when including more rounds, although the SPS was still slightly more predictive than draft capital for all rounds and all UDFA since 2003. This is the reason only the top 4 rounds will be published, with extra insights coming through rankings, social media, etc.
Explaining the Pearson Value: Positive and negative Pearson values can be equally significant but in opposite ways. In the examples seen above, lower (higher value) overall draft capitals suggest a high probability of fantasy scoring, while higher SPS grades strongly indicate a higher fantasy score probability – and in a more significant way than draft capitals do.
| 2006-2015 | |||
| Top 10 | 11 through 40 | Bottom 10 | |
| All count | 28 | 58 | 10 |
| All 71 and above | 25 | 38 | 3 |
| % (Optimal Range/all) | 89.3% | 65.5% | 30.0% |
| 2016-2025 | |||
| Top 10 | 11 through 40 | Bottom 10 | |
| All count | 60 | 86 | 28 |
| All 71 and above | 53 | 55 | 12 |
| % (Optimal Range/all) | 88.3% | 64.0% | 42.9% |
To see whether the SPS is a growing or dying trend, we grouped athletes into the top 10, 11-30th, and bottom 10 categories and split them up into the last 2 decades. Our decadal differences chart showed our optimal SPS range in the most recent decade is sustaining a high rate of success, not growing or declining in predictive power. This indicates that the top performers are increasingly falling within this defined range, highlighting its relevance in today’s game.
As far as the SPS table itself, users can filter and search data efficiently by applying parameters such as year, position, name, SPS scores, or colleges. The green cells in both SPS columns shows that the player is within the optimal range for future success chances. If you’re in green, you’re atop the bellcurve, with 100 being at the very top of the bell curve. The yellow indicates where the performance likelihood decline starts and transitions to red to indicate the players who are on the exponentially declining sides of the bellcurve. These tools and capabilities make it an invaluable asset for evaluating Defensive End performances and finding sleepers or comparing player analytical profiles and future outlooks.

The Star-Predictor Score (SPS) is a scouting tool designed to maximize investment potential and reduce risks when drafting rookies in Fantasy Football. It is proven to have a higher accuracy than draft capital alone to predict fantasy football success. The SPS includes 13 to 17 metrics, with the exact number varying by the player’s position. All these metrics are pre-NFL – some of which are proprietary to BrainyBallers – providing a complete analysis of a player’s analytical profile. The SPS gained widespread notoriety for its high accuracy, having made it on Barstool and The Pat McAfee Show. The SPS can be found here, and future projected SPS grades can be unlocked here.

Don’t just draft for this year. Gain the knowledge needed to position yourself to secure your future with SPS rookie data.
The Star-Predictor Score (SPS) was built as a prospect scouting tool aimed at maximizing investment potential while minimizing risks when drafting rookies in Fantasy Football. With a consistent correlation between higher SPS scores and successful fantasy outcomes, SPS provides the most dependable standard for predicting career fantasy points. Our analysis found that 70.0 and above SPS is the optimal range you should be hoping for in your favorite athletes. Follow us on social media for all things SPS related.
Our series has always sought to push the boundaries of sports analytics. This latest installment reaffirms our commitment to uncovering the hidden dynamics that define the game. We will eventually be posting “Does It Matter?” articles again on a regular basis.


BrainyBallers Buy-Hold-Sell Chart (All Players)
Commanders WR battle 2026: rookie Antonio Williams and value bet Treylon Burks chase the WR2 job opposite Terry McLaurin in Jayden Daniels’ offense.

The 2026 Cowboys WR depth chart, role by role: CeeDee Lamb anchors, George Pickens ascends, Ryan Flournoy sleeps, and everyone else gets squeezed.

Saints WR depth chart 2026: rookie Jordyn Tyson is carving a No. 2 role behind Chris Olave at OTAs, with Juwan Johnson anchoring the passing game.