
Tight Ends: Can College Yardage Help Predict NFL Success?
When evaluating talent for the NFL, analysts often look at a player’s college performance to predict their professional success. In our 64-part


In Part 34 of our “Does It Matter?” series, we looked to find whether a linebacker’s weight could predict their success in the NFL. By crunching the numbers, we found an optimal weight range that might help inform your future rookie draft decisions.
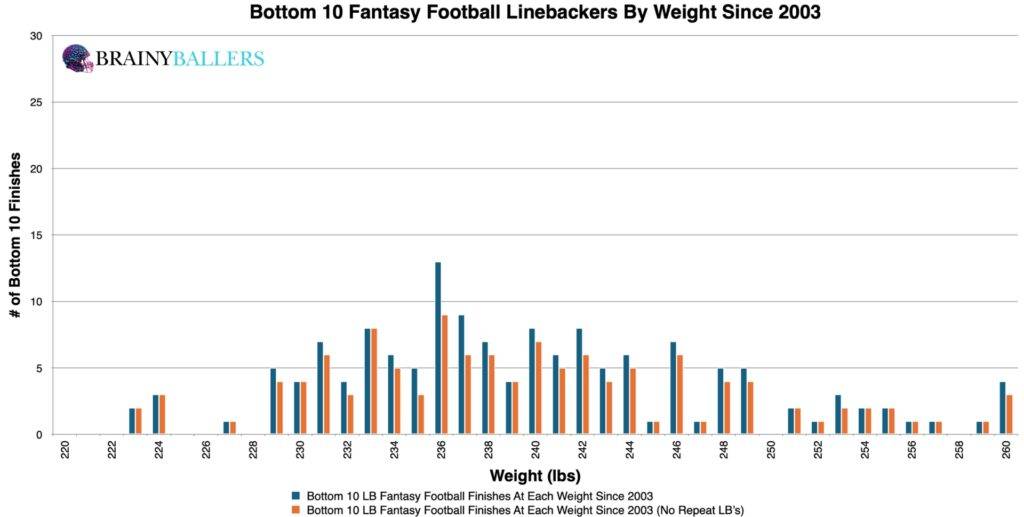
To conduct this research, we examined the top 50 fantasy football finishers since 2003. The “bottom 10”, which you will see throughout this study, is defined as those finishing 41st-50th each season.
Why the top 50? Choosing the top 50 allowed us to find a “happy medium.” Examining past this would involve fringe roster players, unlikely to finish within the top 10 rankings, thereby just skewing our data. By focusing on the 41st-50th place finishers, we were still able to get a comparison between the best and the worst.
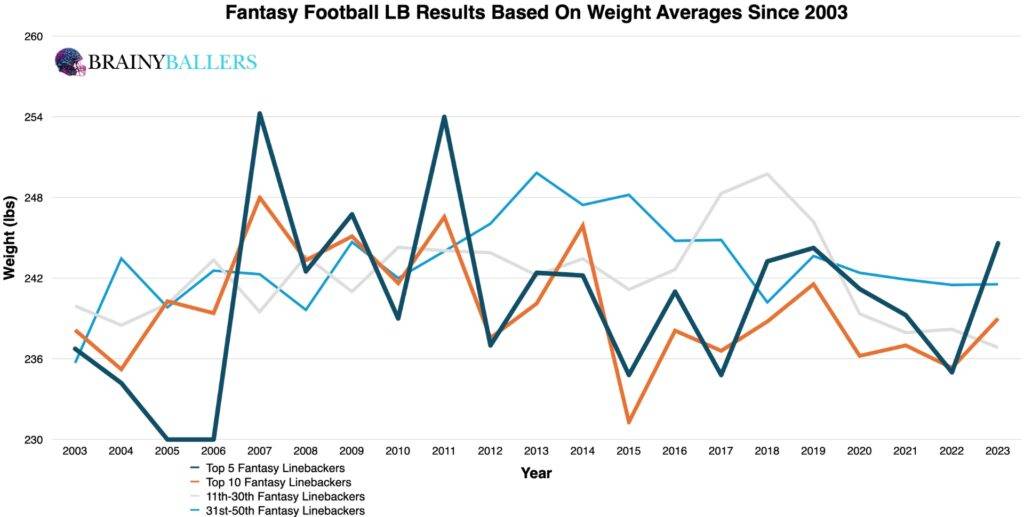
To begin, we created an averages chart which highlights the average weights of players finishing in the top 5, top 10, 11th-30th, and 31st-50th since 2003. Interestingly, our data suggested a subtle trend: smaller linebackers seemed to finish in the top 5 more frequently than those in the 31st-50th slots. In 13 out of the 21 seasons (62%), top 10 finishers exhibited the same, or lower, average weights compared to those in the bottom 10.
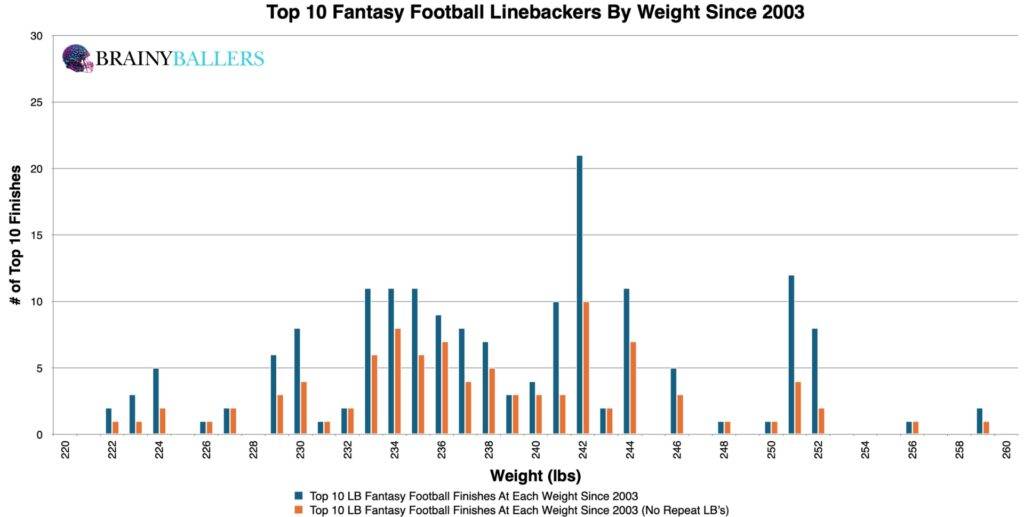
For a more in depth analysis, we segmented the top 10 finishers’ weights into 1-pound increments. This data revealed a slight lean towards weights around 242 pounds within the top 10, driven mainly by the large increase at 242 pounds.
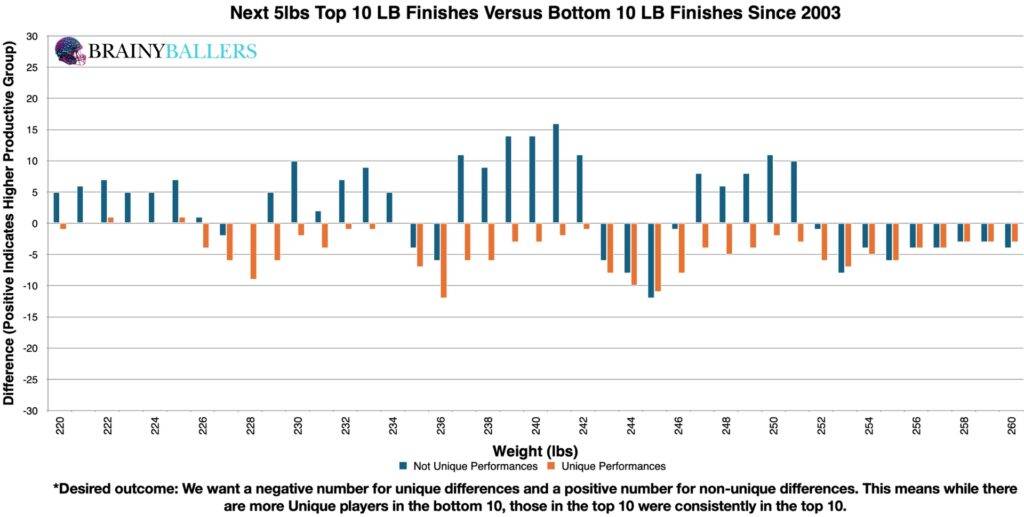
To uncover an optimal weight range, we constructed our differences chart. This tool compared the top 10 performers to the bottom 10 across incremental weight brackets, specifically focusing on each weight, plus the next 5 pounds. The chart’s desired outcome is a negative number for unique differences (Orange) and a positive number for non-unique differences (Blue). This would indicate the desired consistent top level performances we are hoping for. By looking at each weight, adding the next 5-pound increments, and subtracting the bottom 10 results from the top 10 results, initial findings highlighted 256 pounds as a possible top-end threshold. We will next attempt to verify, or debunk, this threshold.
We next wanted to verify the 256 pounds and below threshold. By using our spreadsheet. After running the numbers, we found that adjusting the range to 217-252 pounds prevailed the highest producing range. This range boasted an 18.8% higher appearance rate in top-10 finishers since 2003 when compared to the bottom 10. Therefore, this is our optimal range and will be the subject of this research going forward.
Due to these findings, weight could play a factor in our Star-Predictor Score (SPS) model. Since 270lbs is the highest seen since 2003 in the top 10, this will be the critical value for the SPS. The Star-Predictor Score (SPS) is a scouting tool designed to maximize investment potential and reduce risks when drafting rookies in Fantasy Football. It is proven to have a higher accuracy than draft capital alone to predict fantasy success. The SPS includes 13 to 17 metrics, with the exact number varying by the player’s position. All these metrics are pre-NFL, and some are invented by us, providing a complete analysis of a player’s analytical profiles. The SPS gained widespread notoriety for its high accuracy, having made it on Barstool and The Pat McAfee Show. The SPS can be found here.
We applied standard statistical analysis to measure our data for statistical significance:
This value indicates no significant correlation between linebacker weight and fantasy production. We are hoping for a minimum of 0.1, or an inverse correlation maximum of -0.1 when we study world-class athletes as we are. For reference to something that everyone acknowledges matters in prospect scouting, and to show the accompanying Pearson value, QB draft capital prevailed a -0.219 Pearson value.
To find whether this is an evolving or dying trend, we applied our optimal range to fantasy leaderboards across decades and to the top 10, places 11-40, and the bottom 10. The recent decade prevailed a greater rate of our optimal weight range within the top 10 versus the bottom 10, which indicates this optimal range is a growing trend, not a dying one.
| 2004-2013 | |||
| Top 10 | 11 through 40 | Bottom 10 | |
| All count | 80 | 249 | 79 |
| All between 217-252lbs | 71 | 208 | 62 |
| % (Optimal Range/all) | 88.8% | 83.5% | 78.5% |
| 2014-2023 | |||
| Top 10 | 11 through 40 | Bottom 10 | |
| All count | 94 | 295 | 98 |
| All between 217-252lbs | 90 | 241 | 69 |
| % (Optimal Range/all) | 95.7% | 81.7% | 70.4% |
What 3 metrics matter the most when scouting a rookie Quarterback? What threshold should Quarterbacks achieve within those metrics to be considered an elite prospect? How much should you value those stats above all other stats? Couldn't answer those questions? Rest easy, we have it handled for you. That's what this chart answers. Sort by importance and/or filter by position. Unlock by signing up with the links provided. $9.99/Year or $24.99 Lifetime access. Cancel anytime.
Through a deep analysis, we’ve pinpointed a promising weight range for linebackers that correlates with higher success rates. Although, while weight shows some correlation with NFL success among linebackers, it’s not an absolute predictor, due to just barely missing when it came to standard statistical methods.
Our series has always sought to push the boundaries of sports analytics. This latest installment reaffirms our commitment to uncovering the hidden dynamics that define the game. Every Saturday, we’ll dive into intriguing questions, bust myths, and settle debates with thorough analysis. We welcome your input. Therefore, please leave comments or reach out with topics you’re eager to see dissected. Premium Analytics subscribers get priority. All of our research can be found on our Analytics Page. Up next on our agenda for Part 35 of “Does It Matter?” will be an examination of Linebacker 40 Yard Dashes: Does it matter? If so, what’s the 40-time threshold necessary for NFL success? Mark your calendars; every Saturday we shed light on the topics that matter to you.


BrainyBallers Buy-Hold-Sell Chart (All Players)
Get Your Order 100% Refunded By Predicting The Next SuperBowl Winner!
When evaluating talent for the NFL, analysts often look at a player’s college performance to predict their professional success. In our 64-part

In our 63-part analytical series, “Does It Matter?”, we next wanted to look into the intriguing question of whether a Tight End’s

For our 61 part “Does It Matter?” series, we looked into whether a Wide Receiver’s College Yards After Catch per Reception (YAC/Rec)
