
Tight Ends: Can College Yardage Help Predict NFL Success?
When evaluating talent for the NFL, analysts often look at a player’s college performance to predict their professional success. In our 64-part


For the 11th part of our “Does It Matter?” series, we ventured into the the numbers to see if Relative Athletic Score (RAS) can be used to forecast NFL running back success. Excitingly, our deep dive into the data has uncovered a threshold that has a higher likelihood of increased performance. Here are all our findings:
Relative Athletic Score (RAS) is a metric used to evaluate the athleticism of NFL prospects based on their performances in Combine and Pro Day drills. Developed by Kent Lee Platte in 2013, RAS takes various physical attributes such as speed, agility, explosiveness, and size to normalize them on a scale from 0 to 10. The results are then color-coded to provide a quick visual comparison of a player’s athletic traits relative to other players of the same position. This system helps teams and analysts quickly assess the athletic potential of prospects. Us at BrainyBallers have used RAS religiously in evaluating talents. The RAS database can be found here.
We scrutinized the top 50 fantasy football finishers each season since 2003, exclusively using NFL draft combine data for consistency. For easier visualization, we simplified our charts by rounding each RAS score to the nearest 0.1. PPR fantasy scores was the format used for leaderboards due to its popularity. Here’s a breakdown of our initial process:
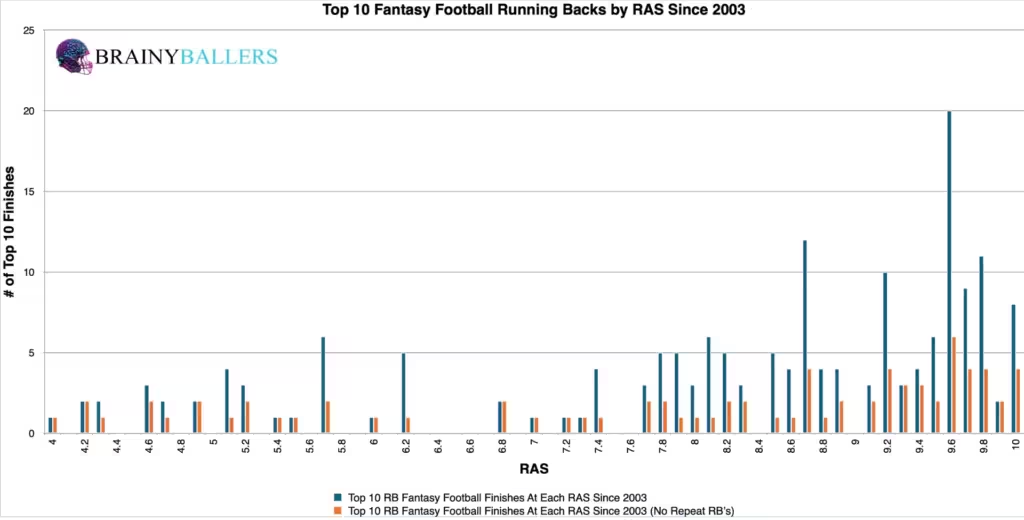
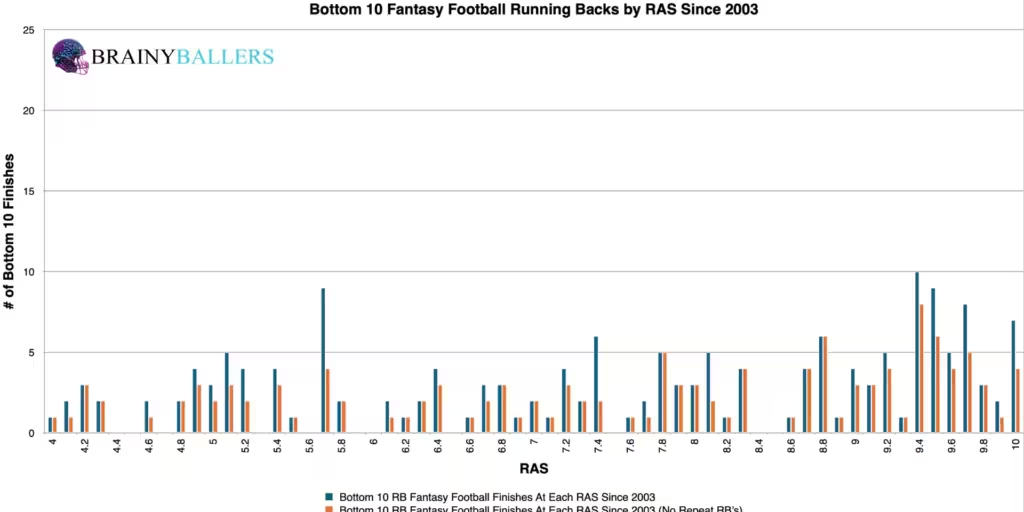
To further understand the Relative Athletic Score threshold’s impact on NFL Running Back success, we began by analyzing the RAS scores of RBs who finished in the bottom 10 in fantasy points between 2003-2023. Among 184 RBs, 93 scored at or above a RAS of 7.6, which equates to 50.5%. This provided our baseline for comparing the effectiveness of this threshold against top-performing RBs. If more than 50.5% occurred in the top 10, then we found an average top 10 RB’s RAS and not just an average NFL Running Back’s RAS. The results were astounding.. Out of 183 top 10 finishers during this timeframe, 135 had RAS scores at or above 7.6, accounting for 73.8%. This is a 23.3% increase from the bottom 10! Last week we found a 24.3% increase when looking at 40 times which was our largest RB finding yet, therefore this closely challenged that as our top RB findings.
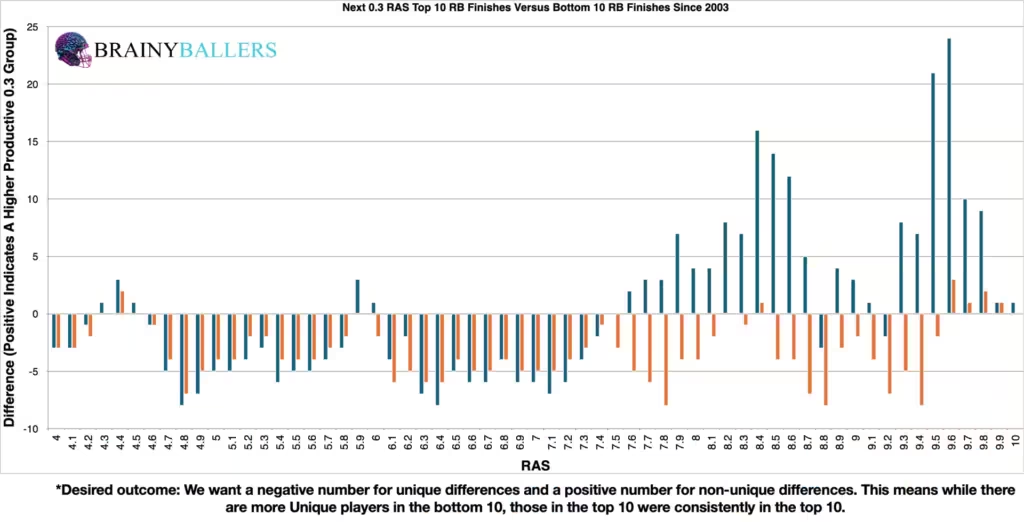
Next, we want to test various ranges close to our initial findings from the differences chart. By doing this, we can verify whether 7.6 and above truly is the best producing threshold. Through this process, we discovered that extending the threshold to 7.45 prevails the same results. Due to this, the 7.45 and above threshold will be the subject of our research going forward.
Due to these findings, RAS could play a factor in our Star-Predictor Score (SPS) model. The Star-Predictor Score (SPS) is a scouting tool designed to maximize investment potential and reduce risks when drafting rookies in Fantasy Football. It is proven to have a higher accuracy than draft capital alone to predict fantasy success. The SPS includes 13 to 17 metrics, with the exact number varying by the player’s position. All these metrics are pre-NFL, and some are invented by us, providing a complete analysis of a player’s analytical profiles. The SPS gained widespread notoriety for its high accuracy, having made it on Barstool and The Pat McAfee Show. The SPS can be found here.
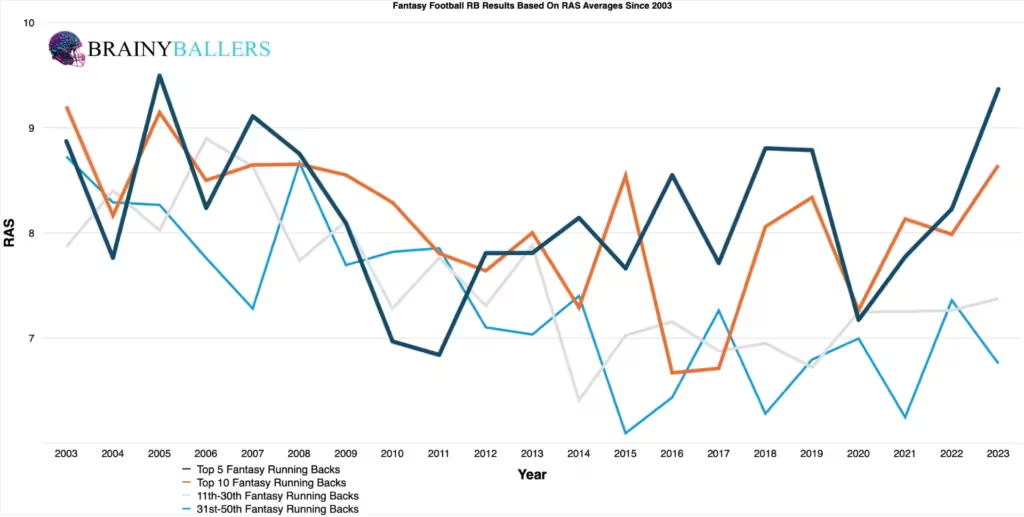
We wanted to lay the numbers out across the last two decades so we can see if this is a recent trend or not. The results revealed this is indeed more of a recent trend. As you can see, from 2014-2023 there is a much larger increase from the bottom 10 to the top 10 than what is seen in the earlier decade.
| 2004-2013 | |||
| Top 10 | 11 through 40 | Bottom 10 | |
| All count | 84 | 230 | 78 |
| At or over 7.45 RAS | 63 | 145 | 50 |
| % (hard zone/all) | 75.0% | 63.0% | 64.1% |
| 2014-2023 | |||
| Top 10 | 11 through 40 | Bottom 10 | |
| All count | 93 | 282 | 99 |
| At or over 7.45 RAS | 67 | 136 | 37 |
| % (hard zone/all) | 72.0% | 48.2% | 37.4% |
Our correlation testing showed a strong correlation between RB RAS coming out of college and NFL Fantasy points.
In research concerning elite athletes like this, a Pearson value over 0.1 or under -0.1 is significant for indicating predictive power. This indicates a meaningful positive relationship between RAS and future fantasy production, meaning higher Relative Athletic Scores typically have higher NFL fantasy scores. For reference to something that everyone acknowledges matters in prospect scouting, and to show the accompanying Pearson value, RB draft capital prevailed a -0.234 Pearson value. Therefore, this shows that RAS can be used as a helpful predictor to aid in deciding between multiple Running Backs.
What 3 metrics matter the most when scouting a rookie Quarterback? What threshold should Quarterbacks achieve within those metrics to be considered an elite prospect? How much should you value those stats above all other stats? Couldn't answer those questions? Rest easy, we have it handled for you. That's what this chart answers. Sort by importance and/or filter by position. Unlock by signing up with the links provided. $9.99/Year or $24.99 Lifetime access. Cancel anytime.
Part 12 of “Does It Matter?” has yielded a key insight: a NFL Running Backs Relative Athletic Score of 7.45 or higher occurs at a 23.3% higher rate than in the bottom 10. 2.3 RAS is the critical threshold. For standard statistical analysis, the Pearson value showed a meaningful relationship. As we continue our research on our way to try to develop a model that predicts NFL success, a RAS of 7.4 is a minimum value we will be utilizing.
Our series has always sought to push the boundaries of sports analytics, and this latest installment reaffirms our commitment to uncovering the hidden dynamics that define the game. Every Saturday We will dive deep into the most intriguing questions, bust myths, and settle debates with thorough analysis similar to this. We thrive on curiosity and welcome your input — so please, leave comments or reach out to us with topics you’re eager to see dissected next. All of our research can be found on our Analytics Page. Up next on our agenda for Part 12 of “Does It Matter?” is our next examination of NFL WR’s: Does BMI matter? If so, what’s the BMI threshold necessary for success? Mark your calendars; every Saturday we shed light on the topics that matter to you. All it takes is a quick question being asked and we will go to work for you!


When evaluating talent for the NFL, analysts often look at a player’s college performance to predict their professional success. In our 64-part

In our 63-part analytical series, “Does It Matter?”, we next wanted to look into the intriguing question of whether a Tight End’s

For our 61 part “Does It Matter?” series, we looked into whether a Wide Receiver’s College Yards After Catch per Reception (YAC/Rec)
