
Tight Ends: Can College Yardage Help Predict NFL Success?
When evaluating talent for the NFL, analysts often look at a player’s college performance to predict their professional success. In our 64-part


In part 47 of our “Does It Matter?” series, we looked to find whether a quarterback’s college career Average Depth of Target (ADOT) can predict their NFL success. By analyzing data from the top 30 NFL finishers since 2013, we found whether there is a correlation between college ADOT and NFL success, specifically within the context of fantasy football scores. Further, we found a threshold that you should be looking for in prospects. Here are all of our findings:
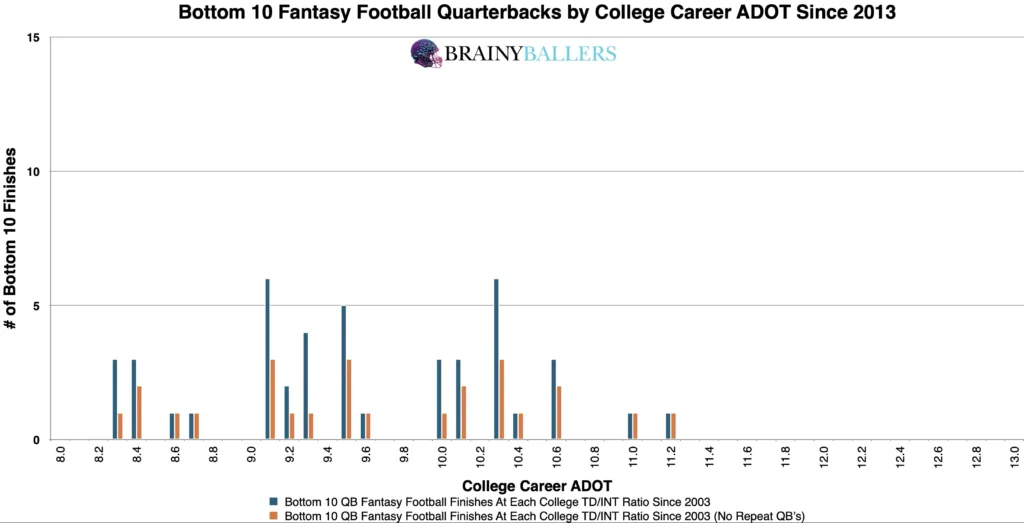
Our analysis looked at the top 30 fantasy football finishers from 2013 onward, since this is when ADOT information began per Pro Football Focus stats. In this study, the term “bottom 10” refers to the players finishing 21st-30th in each NFL season. We only used the career ADOT, not the top or senior season. ADOT stands for Average-Depth-of-Target.
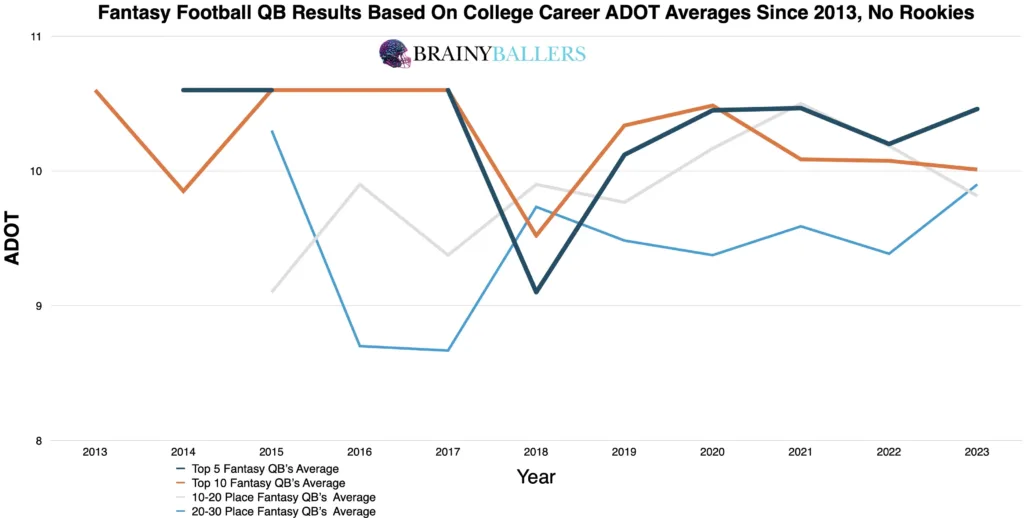
To begin our study, we created an averages chart that categorizes players into 4 brackets: top 5, top 10, 11th-20th, and 21st-30th place finishers. A pattern emerged that showed higher career ADOTs in college generally result in better fantasy football scores in the NFL. 87.5% (7 out of 8) of seasons with available data showed that the top 5 finishers had equal or higher college career ADOTs than those finishing 21st-30th.
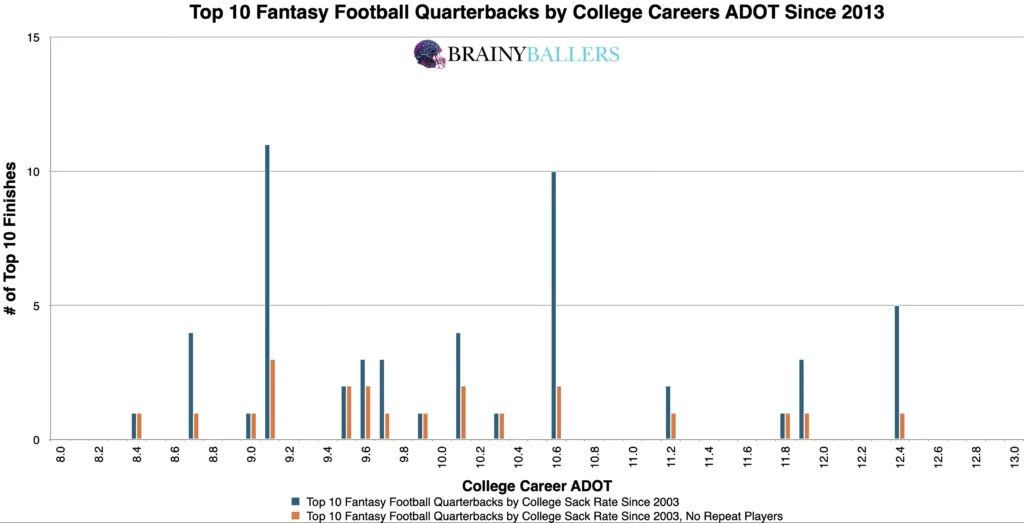
Further, we charted the top 10 finishers since 2013 and broke down the data into 0.1 ADOT increments. This analysis reinforced our initial findings that higher college career ADOT’s correlate with higher fantasy successes. As you can see, the increased occurrence of higher ADOT’s in the top 10 compared to the bottom 10 suggests a possible predictive power in college ADOT.
To find an applicable range or threshold, we utilized our “Differences Chart.” This tool compares each ADOT value plus the next 1.0 increment, subtracting bottom 10 finishers from the top 10. The chart’s desired outcome is a negative number for unique differences (Orange) and a positive number for non-unique differences (Blue). This would indicate the top level consistency we are hoping for. From this analysis, it appeared as though 10.2 and above may be the top producing threshold, which we will next attempt to verify.
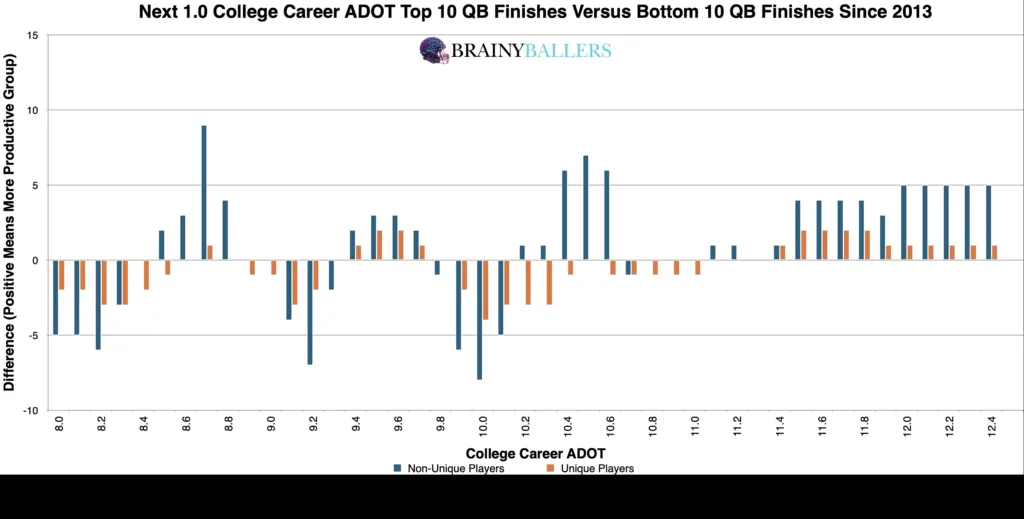
From our differences chart, ADOT values of 10.2 and above appeared to be the optimal performance range. We looked to our spreadsheet to attempt to verify this as the optimal range by adjusting this threshold to various ranges and thresholds. Through this process, we found that an ADOT of 10.4 and above showcased a 44.4% higher appearance rate in the top 5 compared to the bottom 5 finishers. In fact, nobody in the bottom 5 had a college career ADOT of 10.4 or above. This range therefore became the optimal range and will be the focus of this study going forward.
Due to these findings, ADOT could play a factor in our Star-Predictor Score (SPS) model. Since 8.40 ADOT is the lowest seen since 2003 in the top 10, this will be the critical value for the SPS. The Star-Predictor Score (SPS) is a scouting tool designed to maximize investment potential and reduce risks when drafting rookies in Fantasy Football. It is proven to have a higher accuracy than draft capital alone to predict fantasy success. The SPS includes 13 to 17 metrics, with the exact number varying by the player’s position. All these metrics are pre-NFL, and some are invented by us, providing a complete analysis of a player’s analytical profiles. The SPS gained widespread notoriety for its high accuracy, having made it on Barstool and The Pat McAfee Show. The SPS can be found here.
Looking at standard statistical methods prevailed extremely validating results. Between career college ADOT and NFL fantasy football results, the Pearson value came back as 0.32. This indicates a strong predictive power between college career ADOT and NFL fantasy production. We are hoping for a minimum of 0.1, or an inverse correlation maximum of -0.1 when we study world-class athletes as we are. For reference to something that everyone acknowledges matters in prospect scouting, and to show the accompanying Pearson value, QB draft capital prevailed a -0.219 Pearson value. This comparison means ADOT has more significance, just in opposite ways (lower draft capital is better, whereas higher ADOT’s are better).
What 3 metrics matter the most when scouting a rookie Quarterback? What threshold should Quarterbacks achieve within those metrics to be considered an elite prospect? How much should you value those stats above all other stats? Couldn't answer those questions? Rest easy, we have it handled for you. That's what this chart answers. Sort by importance and/or filter by position. Unlock by signing up with the links provided. $9.99/Year or $24.99 Lifetime access. Cancel anytime.
Our dive into the numbers for part 49 of the “Does It Matter?” series showed the predictive power of a quarterback’s college career ADOT. While not the sole predictor of NFL success, it emerges as a significant metric that should be taken into account for decisions on who to draft. You should look for Quarterbacks with an ADOT of 10.4 and above.
Our series has always sought to push the boundaries of sports analytics. This latest installment reaffirms our commitment to uncovering the hidden dynamics that define the game. Every Saturday, we’ll dive into intriguing questions, bust myths, and settle debates with thorough analysis. We welcome your input. Therefore, please leave comments or reach out with topics you’re eager to see dissected. All of our research can be found on our Analytics Page. Up next on our agenda for Part 48 of “Does It Matter?” is an examination of Wide Receiver Star-Predictor Score (SPS): Does It Matter? If so, what’s the SPS Ratio threshold necessary for NFL success? Mark your calendars; every Saturday we shed light on the topics that matter to you. All it takes is a quick question being asked and we will go to work for you!


BrainyBallers Buy-Hold-Sell Chart (All Players)
Get Your Products 100% Refunded By Predicting The Next SuperBowl Winner!
When evaluating talent for the NFL, analysts often look at a player’s college performance to predict their professional success. In our 64-part

In our 63-part analytical series, “Does It Matter?”, we next wanted to look into the intriguing question of whether a Tight End’s

For our 61 part “Does It Matter?” series, we looked into whether a Wide Receiver’s College Yards After Catch per Reception (YAC/Rec)
