
Tight Ends: Can College Yardage Help Predict NFL Success?
When evaluating talent for the NFL, analysts often look at a player’s college performance to predict their professional success. In our 64-part


In part 46 of our “Does It Matter?” series, we looked into Quarterback college completion percentages to see if it can predict their NFL success. We had great results with standard statistical methods which you will see within this article. Here’s everything that our number-crunching prevailed:
Our study focused on the top 30 fantasy football finishers each season since 2003. The data came from College Football Reference, and we only used the career completion percentage, not the top or senior season. Further, we excluded rookie seasons to not include quarterbacks before they typically mature.
To set the stage, you will see the term “bottom 10” throughout this study. This is used to describe fantasy finishers ranked 21st to 30th each season.
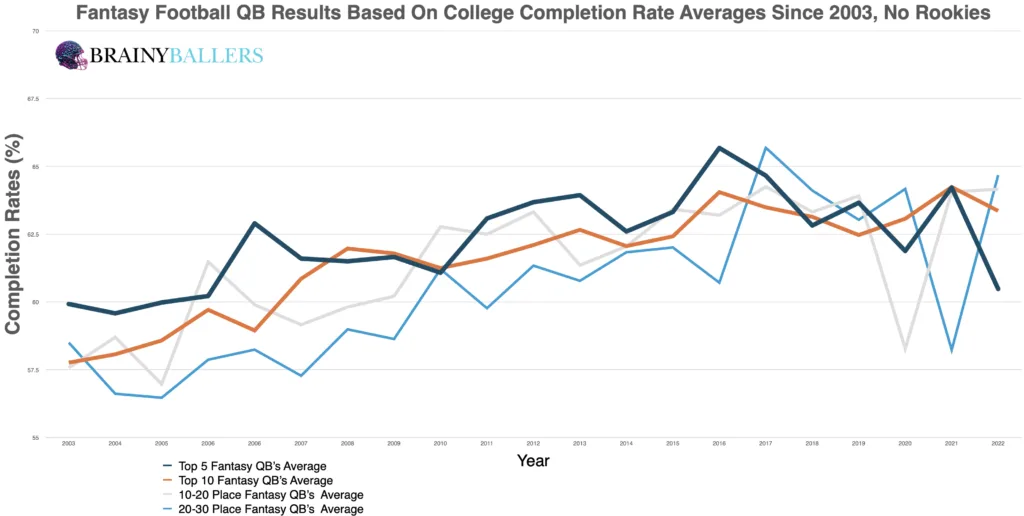
To understand any obvious patterns, we created an averages chart for quarterbacks based on their fantasy finishes. From this, we noticed that In 17 out of 21 seasons (80.9%), top 5 finishers had higher average college completion percentages compared to the 20th-30th place finishers. From this, it started becoming obvious that higher college completion percentages probably led to better fantasy scores.
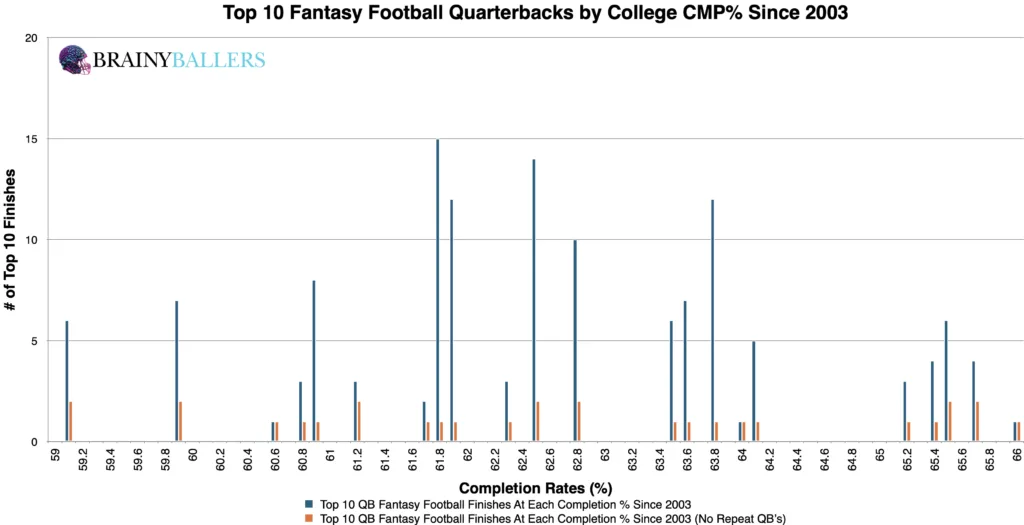
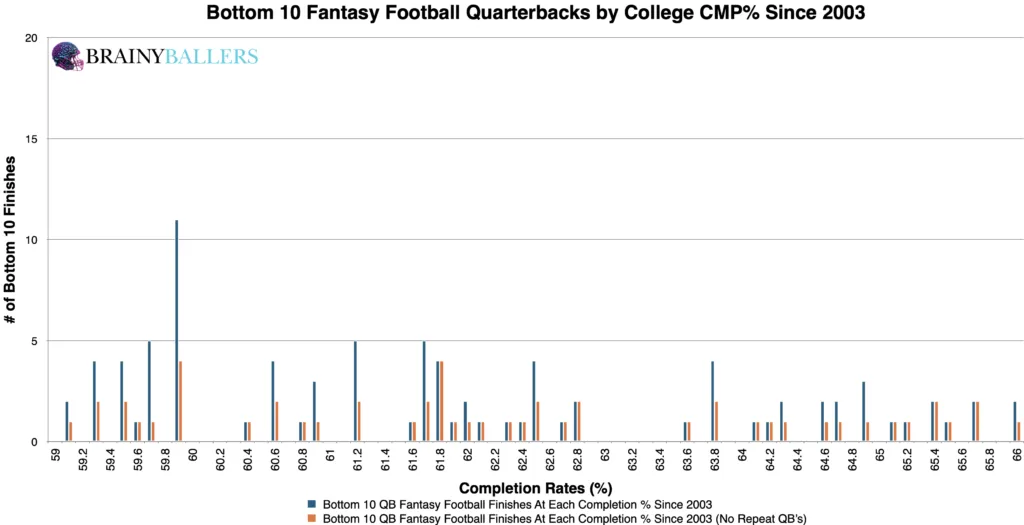
Next, we charted the top and bottom 10 finishers since 2003 and segmented them into 0.1 increments. This segmentation further showcased the apparent correlation that quarterbacks with higher college completion rates often had higher fantasy football success. Those charts can be seen below, where you can compare the weight of both, with the top 10 coming first:
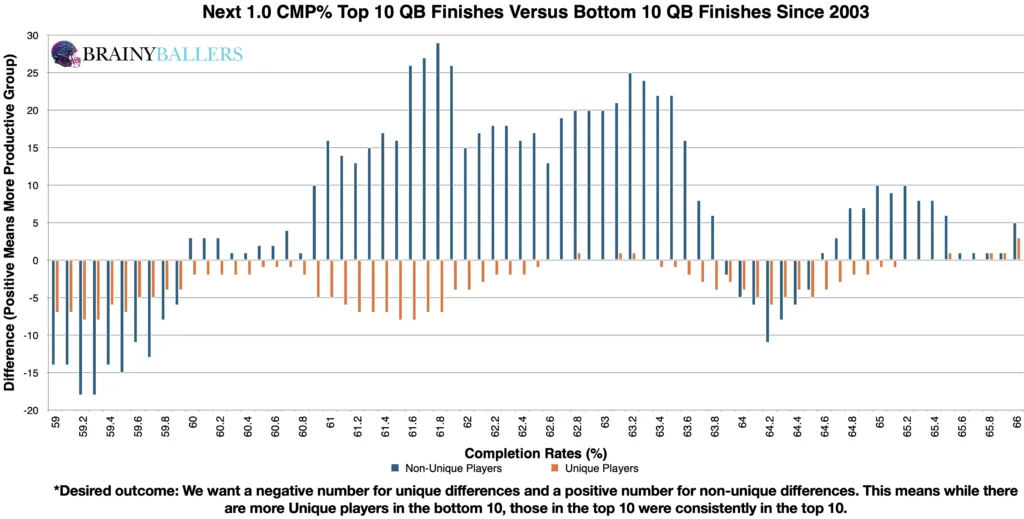
To pinpoint an optimal range where higher fantasy football finishes occurred at, we first constructed a differences chart. This involved comparing each college completion percentage with the subsequent 1.0% increment, subtracting the bottom 10 performance results from the top 10. The chart’s desired outcome is a negative number for unique differences (Orange) and a positive number for non-unique differences (Blue). This would indicate the top level consistency we are hoping for. From this analysis, a clear pattern emerged: quarterbacks with a completion percentage of 60.9% and above stood out as the probable top performers. We next will attempt to verify that threshold.
Our next step was refining this range to ensure it represented the highest performing threshold. Through adjustments, we altered this threshold to a slightly broader completion percentage of 60.7% and above. This threshold resulted in a 37.4% higher appearance rate in the top 10 compared to the bottom 10. Therefore, this range will serve as the basis of this study moving forward, and will be our optimal range for QB College Completion Percentages.
Due to these findings, completion percentage could play a factor in our Star-Predictor Score (SPS) model. Since 50.7% is the lowest seen since 2003 in the top 10, this will be the critical value for the SPS. The Star-Predictor Score (SPS) is a scouting tool designed to maximize investment potential and reduce risks when drafting rookies in Fantasy Football. It is proven to have a higher accuracy than draft capital alone to predict fantasy success. The SPS includes 13 to 17 metrics, with the exact number varying by the player’s position. All these metrics are pre-NFL, and some are invented by us, providing a complete analysis of a player’s analytical profiles. The SPS gained widespread notoriety for its high accuracy, having made it on Barstool and The Pat McAfee Show. The SPS can be found here.
Utilizing standard statistical methods, we looked to see if there was statistical significance between college completion percentages and NFL fantasy football points. The Pearson value can be seen below:
This value shows strong correlation between a quarterback’s college career completion percentage and their fantasy production. We are hoping for a minimum of 0.1, or an inverse correlation maximum of -0.1 when we study world-class athletes as we are. For reference to something that everyone acknowledges matters in prospect scouting, and to show the accompanying Pearson value, QB draft capital prevailed a -0.219 Pearson value. This comparison means these stats have very similar significance, just in opposite ways (lower draft capital is better, whereas higher completion percentages are better).
Understanding trends over time can provide more valuable insights. By applying our optimal range over the last two decades, we observed that our identified optimal range, though on a decline, remained a relevant indicator of success for quarterbacks. That can be seen in our chart below, where the blue numbers show the bottom 5 and top 5 prevalence of our optimal range for each decade:
| 2004-2013 | |||
| Top 5 | 6 through 24 | Bottom 5 | |
| All count | 49 | 183 | 47 |
| All 60.7 and above | 38 | 81 | 13 |
| % (Optimal Range/all) | 77.6% | 44.3% | 27.7% |
| 2014-2023 | |||
| Top 5 | 6 through 24 | Bottom 5 | |
| All count | 50 | 195 | 46 |
| All 60.7 and above | 41 | 151 | 26 |
| % (Optimal Range/all) | 82.0% | 77.4% | 56.5% |
What 3 metrics matter the most when scouting a rookie Quarterback? What threshold should Quarterbacks achieve within those metrics to be considered an elite prospect? How much should you value those stats above all other stats? Couldn't answer those questions? Rest easy, we have it handled for you. That's what this chart answers. Sort by importance and/or filter by position. Unlock by signing up with the links provided. $9.99/Year or $24.99 Lifetime access. Cancel anytime.
Our analysis found a significant link between college completion percentages and NFL quarterback success. Our study identified a threshold of 60.7% and above for college completion percentages, with higher ones being a reliable predictor of NFL quarterback success.
Our series has always sought to push the boundaries of sports analytics. This latest installment reaffirms our commitment to uncovering the hidden dynamics that define the game. Every Saturday, we’ll dive into intriguing questions, bust myths, and settle debates with thorough analysis. We welcome your input. Therefore, please leave comments or reach out with topics you’re eager to see dissected. All of our research can be found on our Analytics Page. Up next on our agenda for Part 47 of “Does It Matter?” is an examination of Quarterback ADOT: Does it matter? If so, what’s the ADOT threshold necessary for NFL success? Mark your calendars; every Saturday we shed light on the topics that matter to you. All it takes is a quick question being asked and we will go to work for you!


BrainyBallers Buy-Hold-Sell Chart (All Players)
Get Your Products 100% Refunded By Predicting The Next SuperBowl Winner!
When evaluating talent for the NFL, analysts often look at a player’s college performance to predict their professional success. In our 64-part

In our 63-part analytical series, “Does It Matter?”, we next wanted to look into the intriguing question of whether a Tight End’s

For our 61 part “Does It Matter?” series, we looked into whether a Wide Receiver’s College Yards After Catch per Reception (YAC/Rec)
