
Tight Ends: Can College Yardage Help Predict NFL Success?
When evaluating talent for the NFL, analysts often look at a player’s college performance to predict their professional success. In our 64-part


For the 45th installment of the “Does It Matter?” series, we looked into quarterback college sack rates. The objective was to see if sack rate percentages were consistently predictive of either high or low fantasy finishes. From this research, we found an optimal sack percentage range that occurred at a higher rate which you can apply to your prospect scouting. Here are all of our findings:
Our research focused on the top 30 fantasy football finishers since 2003, utilizing PPR (Points Per Reception) scores as the league scoring system. Throughout this study, you will see the term “bottom 10”, which refers to those ranked 21st to 30th each season.
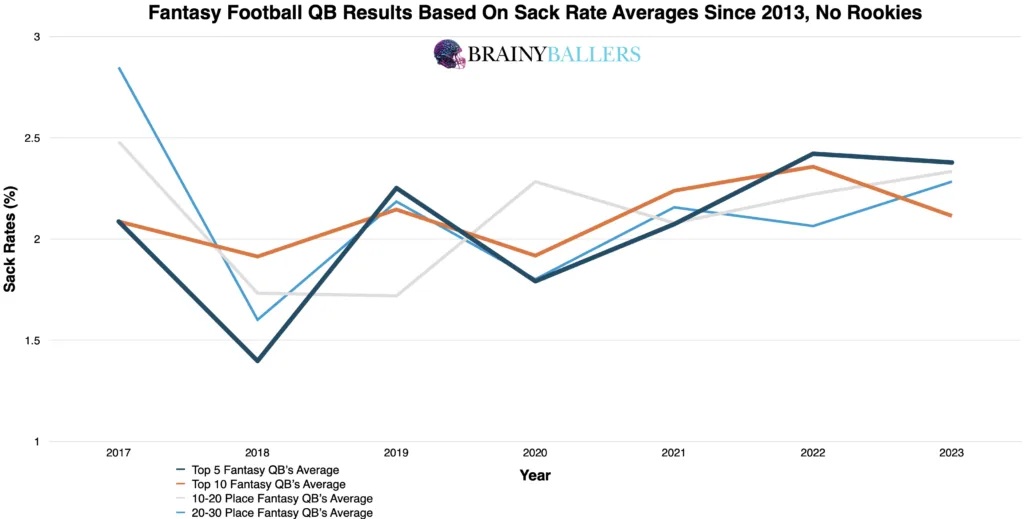
To begin our research, we constructed an averages chart which analyzes quarterbacks who finished in the top 5, top 10, 11th-20th, and 21st-30th place in fantasy leagues since 2003. This approach yielded little insights as we struggled to identify trends in sack rate percentages amongst these groups when compared to each other.
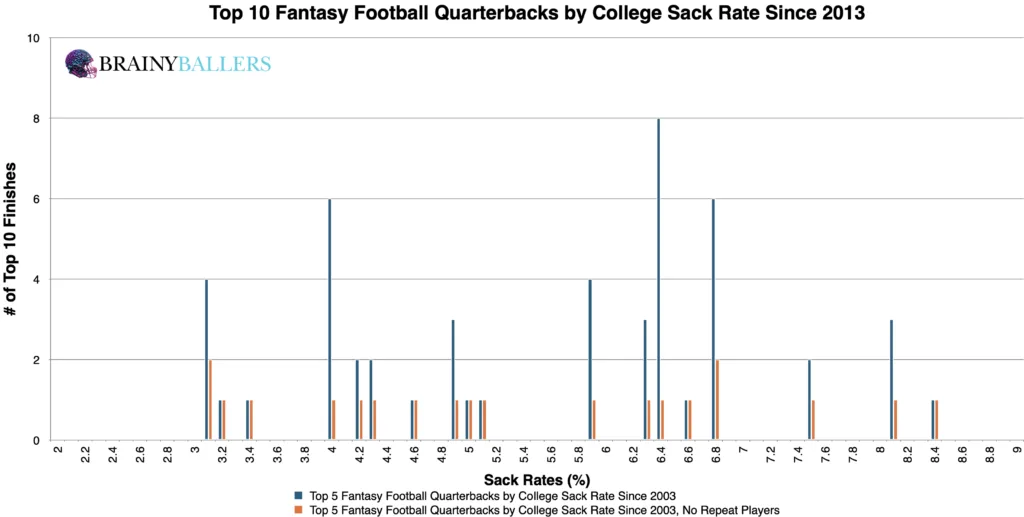
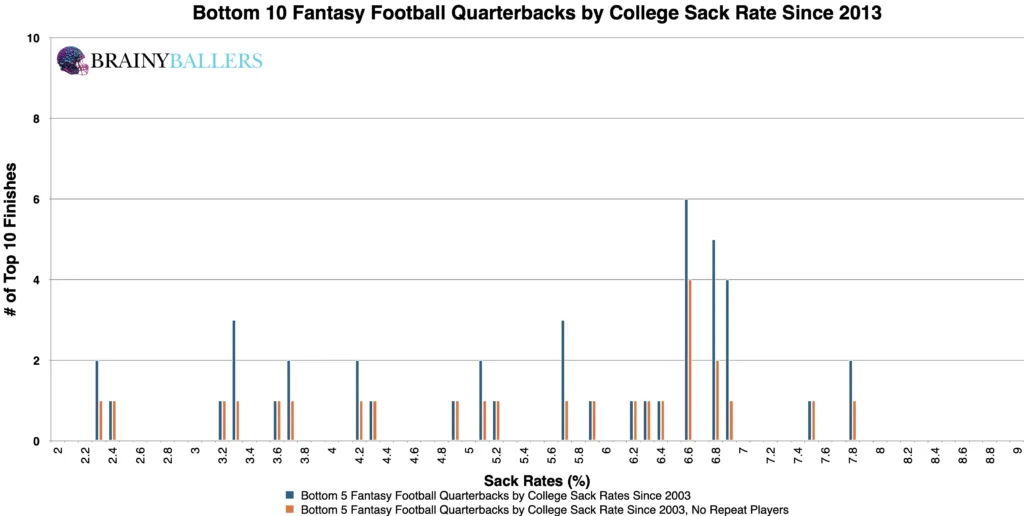
To dive deeper into this analysis, we segmented the sack rate percentages of top and bottom 10 fantasy finishers into 0.1 increments. This was an attempt to see if one of the charts had an obvious weight difference between each other. Although, this data did not prevail any obvious differences. Those charts can be seen below, with the top 10 coming first:
Our main goal was to pinpoint a range where notable performance increases occur in the NFL. To do this, we developed a differences chart. This chart compares each sack rate percentage, plus the next 1.0%, by subtracting the bottom 10 results from the top 10. The chart’s desired outcome is a negative number for unique differences (Orange) and a positive number for non-unique differences (Blue). This would indicate the top level consistency we are hoping for. From this analysis, we discovered that a sack rate of 6.9% and below consistently appeared to be a top-performing range, bringing us closer to understanding the potential optimal range for this stat, which we will attempt to verify next.
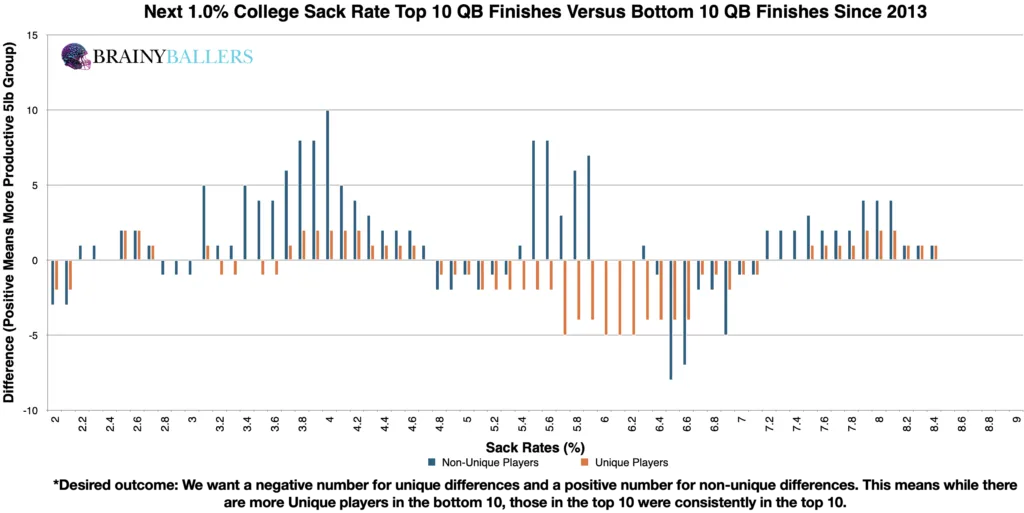
The next step involved some number-crunching. We made adjustments in our spreadsheet to help identify the most productive sack rate range. Through testing various numbers near the range identified by our differences chart, we concluded that altering this range to 2.4% to 6.5% produced a 17.3% higher top 10 appearance rate compared to the bottom 10. Therefore, this range will serve as the basis of this study moving forward, and will be our optimal range for QB College sack rates.
Due to these findings, Sack Rates could play a factor in our Star-Predictor Score (SPS) model. Since 8.40% is the highest seen since 2003 in the top 10, this will be the critical value for the SPS. The Star-Predictor Score (SPS) is a scouting tool designed to maximize investment potential and reduce risks when drafting rookies in Fantasy Football. It is proven to have a higher accuracy than draft capital alone to predict fantasy success. The SPS includes 13 to 17 metrics, with the exact number varying by the player’s position. All these metrics are pre-NFL, and some are invented by us, providing a complete analysis of a player’s analytical profiles. The SPS gained widespread notoriety for its high accuracy, having made it on Barstool and The Pat McAfee Show. The SPS can be found here.
Utilizing standard statistical methods prevailed no significant findings:
This value shows no strong correlation between a quarterback’s college sack rate and their fantasy production. We are hoping for a minimum of 0.1, or an inverse correlation maximum of -0.1 when we study world-class athletes as we are. For reference to something that everyone acknowledges matters in prospect scouting, and to show the accompanying Pearson value, QB draft capital prevailed a -0.219 Pearson value.
What 3 metrics matter the most when scouting a rookie Quarterback? What threshold should Quarterbacks achieve within those metrics to be considered an elite prospect? How much should you value those stats above all other stats? Couldn't answer those questions? Rest easy, we have it handled for you. That's what this chart answers. Sort by importance and/or filter by position. Unlock by signing up with the links provided. $9.99/Year or $24.99 Lifetime access. Cancel anytime.
While our study identified a specific percentage that appeared far more frequently within the top 10 fantasy finishers compared to the bottom 10, it is crucial to acknowledge the lack of statistical correlation when using standard methods. College sack rates may provide some insight into a quarterback’s potential success, but they are not singularly predictive. If you use this to evaluate Quarterbacks, look for Quarterbacks with a college sack rate between 2.4% to 6.5%.
Our series has always sought to push the boundaries of sports analytics. This latest installment reaffirms our commitment to uncovering the hidden dynamics that define the game. Every Saturday, we’ll dive into intriguing questions, bust myths, and settle debates with thorough analysis. We welcome your input. Therefore, please leave comments or reach out with topics you’re eager to see dissected. All of our research can be found on our Analytics Page. Up next on our agenda for Part 46 of “Does It Matter?” is an examination of Quarterback college completion percentage: Does it matter? If so, what’s the completion percentage threshold necessary for NFL success? Mark your calendars; every Saturday we shed light on the topics that matter to you. All it takes is a quick question being asked and we will go to work for you!


BrainyBallers Buy-Hold-Sell Chart (All Players)
Get Your Products 100% Refunded By Predicting The Next SuperBowl Winner!
When evaluating talent for the NFL, analysts often look at a player’s college performance to predict their professional success. In our 64-part

In our 63-part analytical series, “Does It Matter?”, we next wanted to look into the intriguing question of whether a Tight End’s

For our 61 part “Does It Matter?” series, we looked into whether a Wide Receiver’s College Yards After Catch per Reception (YAC/Rec)
