
Tight Ends: Can College Yardage Help Predict NFL Success?
When evaluating talent for the NFL, analysts often look at a player’s college performance to predict their professional success. In our 64-part


For part 44 of our “Does It Matter?” series, we investigated whether a Running Back’s college yards per carry (YPC) can predict their NFL success. We found an optimal range where an increased rate in the top 10 occurs and applied standard statistical methods. Here are all of our findings:
We gathered data on the top 50 Fantasy Football PPR (points per reception) standings since 2003. Within this article, you will see the term “bottom 10”, which is defined as those ranking 41st to 50th in fantasy points each season.
Why the top 50? We opted to examine the top 50 finishers to strike a “happy medium.” Analyzing further down the leaderboard would include fringe roster players unlikely to finish in the top 10, potentially just skewing the data. On the other hand, we wanted to compare the best to the worst, therefore we went down to the 41st-50th place finishers to achieve this.
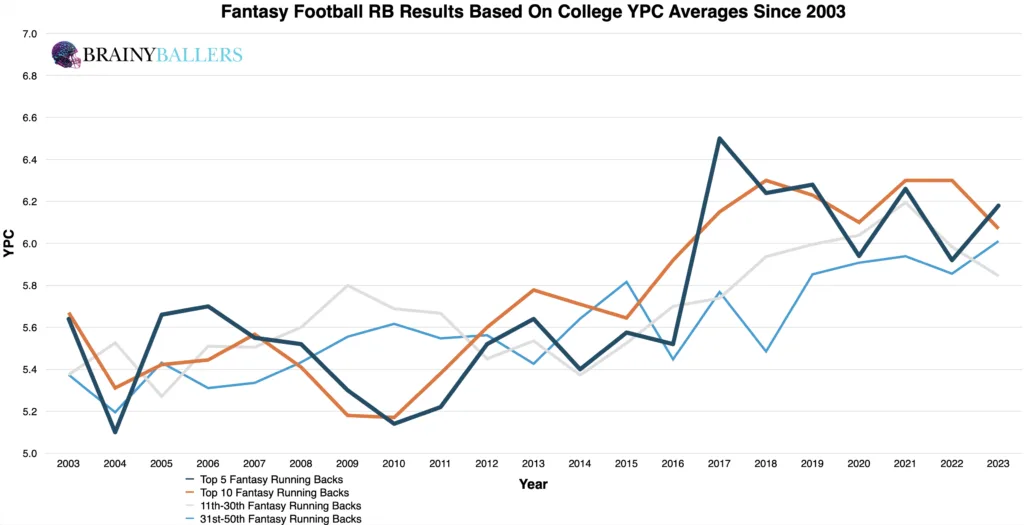
To begin understanding the connection between college YPC and NFL performance, we looked to our averages chart which compares the top 5, top 10, 11-30th, and 31-50th place finishers each season. A slight trend emerged: in 14 out of 21 seasons (66.7%), the college YPC averages of the top 5 finishers were equal to, or higher, than those in the 31st-50th range. This suggested a potential correlation between higher college YPC and elevated NFL fantasy success.
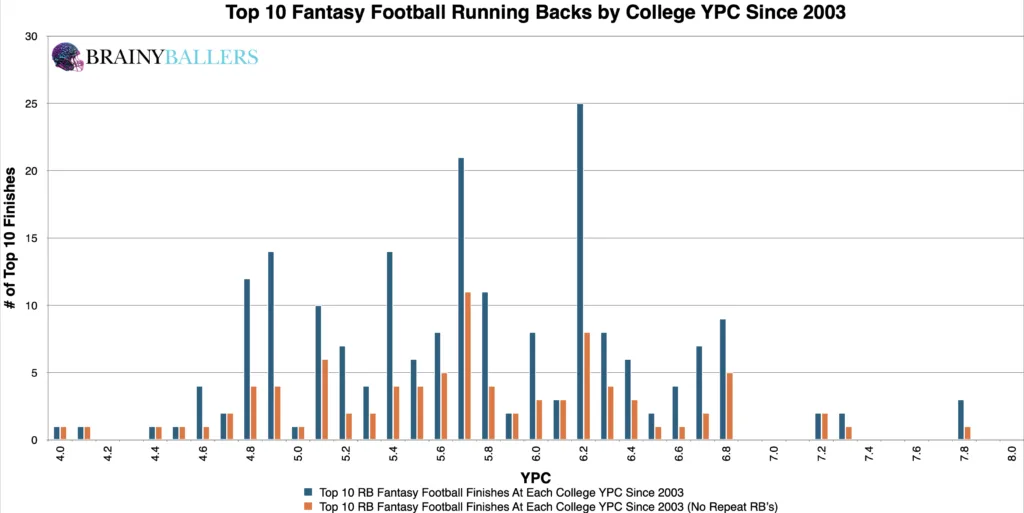
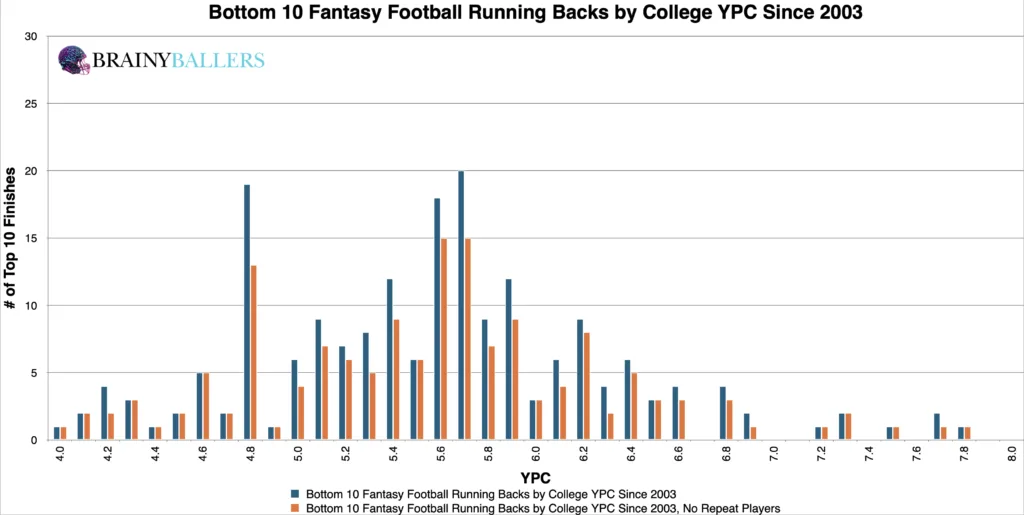
Further, we segmented the data of top and bottom 10 performers since 2003 into 0.1 increments. This revealed a clear weight towards higher YPC more frequently resulting within the top 10 finishers. This concentration of higher YPC in the top 10 reinforced the hypothesis that higher college YPC often prevails higher NFL success. Those two charts can be seen below, with the top 10 coming first:
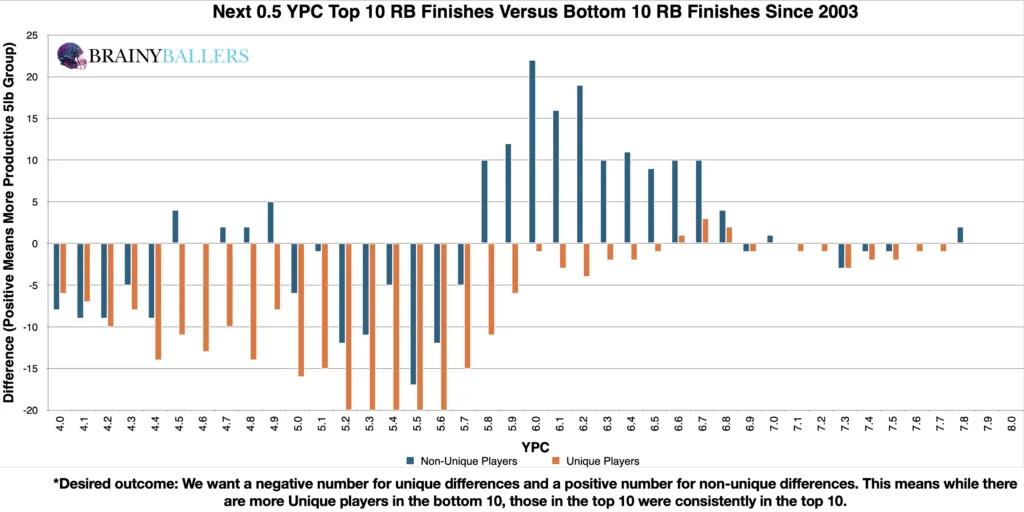
Our primary objective was to identify a YPC range or threshold that maximizes performance gains. We wanted to do this while also maintaining consistent player appearances in the top 10. In other words, trying to not count the one-hit wonders of the league. To do this, we created our differences chart, which compares each YPC increment, plus the next 0.5 YPC, subtracting the bottom 10 results from the top 10. The chart’s desired outcome is a negative number for unique differences (Orange) and a positive number for non-unique differences (Blue). This would indicate the top level consistency we are hoping for. From this, A possible optimal range stood out which was 5.8 YPC and above. We next will attempt to verify this as the top producing range.
With these findings, we now wanted to sharpen the College YPC optimal range. By testing various numbers adjacent to our possible optimal range, we discovered that a threshold of 6.0 YPC and above significantly boosts top 10 appearances—14.1% higher than all bottom 10 players. Therefore, this optimal range will be the subject of our research going forward.
Due to these findings, YPC could play a factor in our Star-Predictor Score (SPS) model. Since 4.0 YPC is the lowest seen since 2003 in the top 10, this will be the critical value for the SPS. The Star-Predictor Score (SPS) is a scouting tool designed to maximize investment potential and reduce risks when drafting rookies in Fantasy Football. It is proven to have a higher accuracy than draft capital alone to predict fantasy success. The SPS includes 13 to 17 metrics, with the exact number varying by the player’s position. All these metrics are pre-NFL, and some are invented by us, providing a complete analysis of a player’s analytical profiles. The SPS gained widespread notoriety for its high accuracy, having made it on Barstool and The Pat McAfee Show. The SPS can be found here.
We next employed standard statistical methods, which revealed the following results:
These findings reveal no strong correlation between college YPC and fantasy production while strictly using statistical standards. Although, we noticed that from 2012 onward there was correlation, as seen above as well. We are hoping for a minimum of 0.1, or an inverse correlation maximum of -0.1 when we study world-class athletes as we are. For reference to something that everyone acknowledges matters in prospect scouting, and to show the accompanying Pearson value, QB draft capital prevailed a -0.219 Pearson value.
To identify timely trends, we compared our YPC optimal range across the last two decades, examining the top 10, 11-40th, and bottom 10 finishers. The data shows that the 6.0 and above YPC threshold is a growing trend, reinforcing its significance.
| 2004-2013 | |||
| Top 10 | 11 through 40 | Bottom 10 | |
| All count | 94 | 275 | 95 |
| All 6 and above YPC | 17 | 59 | 15 |
| % (Optimal Range/all) | 18.1% | 21.5% | 15.8% |
| 2014-2023 | |||
| Top 10 | 11 through 40 | Bottom 10 | |
| All count | 96 | 281 | 92 |
| All 6 and above YPC | 59 | 116 | 34 |
| % (Optimal Range/all) | 61.5% | 41.3% | 37.0% |
What 3 metrics matter the most when scouting a rookie Quarterback? What threshold should Quarterbacks achieve within those metrics to be considered an elite prospect? How much should you value those stats above all other stats? Couldn't answer those questions? Rest easy, we have it handled for you. That's what this chart answers. Sort by importance and/or filter by position. Unlock by signing up with the links provided. $9.99/Year or $24.99 Lifetime access. Cancel anytime.
Our analysis revealed a trend where higher college YPC predicts better NFL success. While scouting college prospects, you should hope for a 6.0 and above YPC. While college YPC can be a promising metric, it’s best to be viewed as a small piece of the predictive puzzle rather than an absolute indicator. It will hold weight in our SPS model due to the optimal range 14.1% increase from the bottom 10 to the top 10.
Our series has always sought to push the boundaries of sports analytics. This latest installment reaffirms our commitment to uncovering the hidden dynamics that define the game. Every Saturday, we’ll dive into intriguing questions, bust myths, and settle debates with thorough analysis. We welcome your input. Therefore, please leave comments or reach out with topics you’re eager to see dissected. All of our research can be found on our Analytics Page. Up next on our agenda for Part 45 of “Does It Matter?” is an examination of Quarterback college sack rate: Does it matter? If so, what’s the sack rate threshold necessary for NFL success? Mark your calendars; every Saturday we shed light on the topics that matter to you. All it takes is a quick question being asked and we will go to work for you!


BrainyBallers Buy-Hold-Sell Chart (All Players)
Get Your Products 100% Refunded By Predicting The Next SuperBowl Winner!
When evaluating talent for the NFL, analysts often look at a player’s college performance to predict their professional success. In our 64-part

In our 63-part analytical series, “Does It Matter?”, we next wanted to look into the intriguing question of whether a Tight End’s

For our 61 part “Does It Matter?” series, we looked into whether a Wide Receiver’s College Yards After Catch per Reception (YAC/Rec)
