
Tight Ends: Can College Yardage Help Predict NFL Success?
When evaluating talent for the NFL, analysts often look at a player’s college performance to predict their professional success. In our 64-part


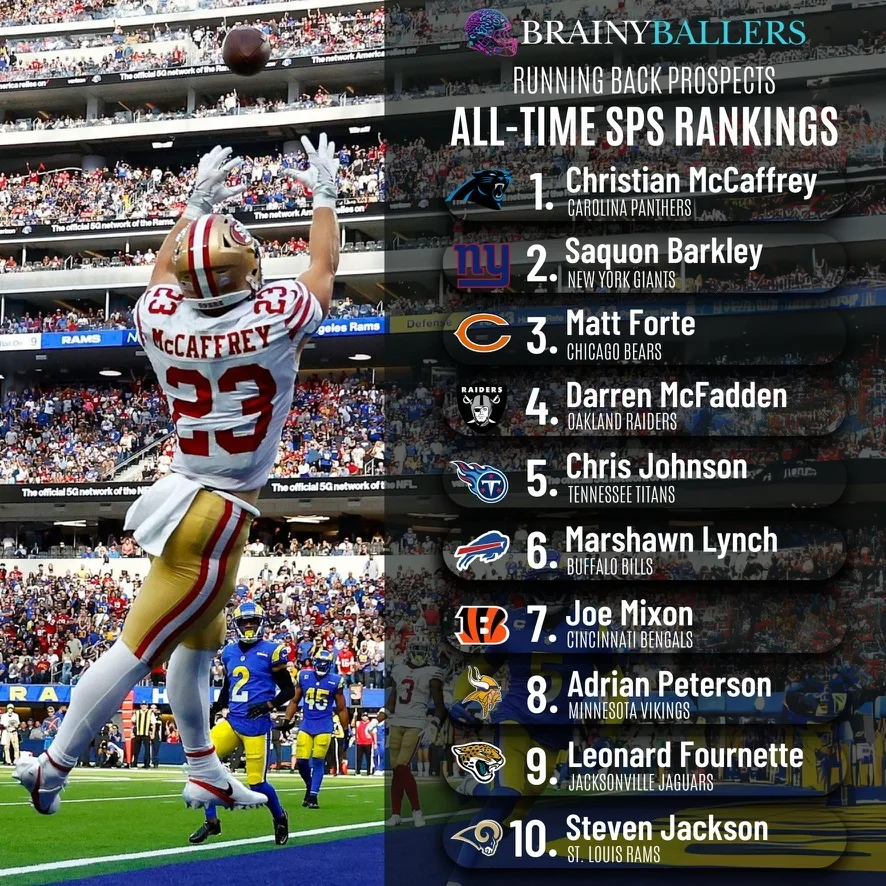
For the 52nd entry in our “Does It Matter?” series, we explore how effectively the Running Back Star-Predictor Score (SPS), found here, forecasts the future success of running backs while using it as a scouting tool. This study explores the SPS’s ability to predict career success and will establish the ideal benchmark for player assessment. Currently, Christian McCaffrey, Saquon Barkley, and Matt Forte are ranked first, second, and third all-time, respectively, with the top 10 boasting an impressive 29 Pro Bowl appearances. Using data since 2003, this article guides you on how the SPS can help identify undervalued players and verify or challenge the public consensus of the star potential in top NFL Draft picks. Here are all of our findings:
The Star-Predictor Score (SPS) was built as a prospect scouting tool aimed at maximizing investment potential while minimizing risks when drafting rookies in Fantasy Football. Developed using data since 2003, the SPS formula was then applied to every drafted or undrafted free agent (UDFA) since then. From that, and out of a total of 587 Running Backs, the following top 10 prevailed:
Our analysis first focused on the top 50 fantasy football finishers since 2003, utilizing Points Per Reception fantasy scores. Then, by comparing the SPS coefficient with the draft capital coefficient relative to players’ career fantasy points, we determined which measure holds more predictive power. The Star-Predictor Score (SPS) for Running Backs utilizes 17 distinct metrics from various sources to come together into one predictive model. It is presented in a percentile grading system, therefore the top player ever (Christian McCaffrey) will have a 100.0 SPS grade. If a prospect ever enters the NFL with a superior analytical profile to Christian McCaffrey, McCaffrey’s SPS grade will decrease, though this adjustment will be relative to all other players.
Why only the top 50? We utilized this established methodology to accurately compare this metric with all the other metrics we have previously examined against the top 50. We selected the top 50 to maintain a “happy medium.” Going further than the top 50 would include fringe roster players who are unlikely to finish top 10 and therefore would potentially just skew the data. Conversely, we aim to compare the worst to the best, necessitating a range of players distinctly different from the top 10. Therefore, we examined the 41st-50th place finishers for comparison with the top 10, which we refer to as the “bottom 10″ throughout this article”.
Before we get into the research itself, it’s important to note where the SPS excels at. To sum it up; the SPS specializes in 1st, 2nd, and 3rd round Running Backs. Therefore, all 1st, 2nd, and 3rd round RB’s will be published on our table. The higher their SPS, the more likely they are to have career success, measured by fantasy points. The players in the green signify a greater chance of career success than for those not marked in green, which is where the performance likelihood significant drop-off begins.
Take Bucky Irving as the most recent example. Typically, he was regarded to as roughly the 5th or 6th best Running Back in the 2024 NFL Draft class. Per the SPS, he was the 3rd overall RB in the 2024 class. Going back one year before that, Jahmyr Gibbs was mostly always behind Bijan Robinson in rookie rankings. Per the SPS, Jahmyr’s 81.5 SPS versus Bijan’s 71.6 could have netted you great value in a trade while drafting the better Running Back (thus far), seen here:
Further, in 2023 DeVon Achane was the SPS RB3. These examples demonstrate how the SPS can inform your draft and trade choices. If you had a top rookie draft pick in 2023, you might have been more inclined to trade back and draft Jahmyr, gaining an additional asset in the process, instead of maintaining your spot for Bijan Robinson. In simple terms, the SPS revealed that there was actually no gap between Bijan and Jahmyr, therefore contradicting what most industry experts were telling us. By no means is this calling Bijan a bust going forward, it is simply contradicting the common belief that Bijan was in a tier of his own.
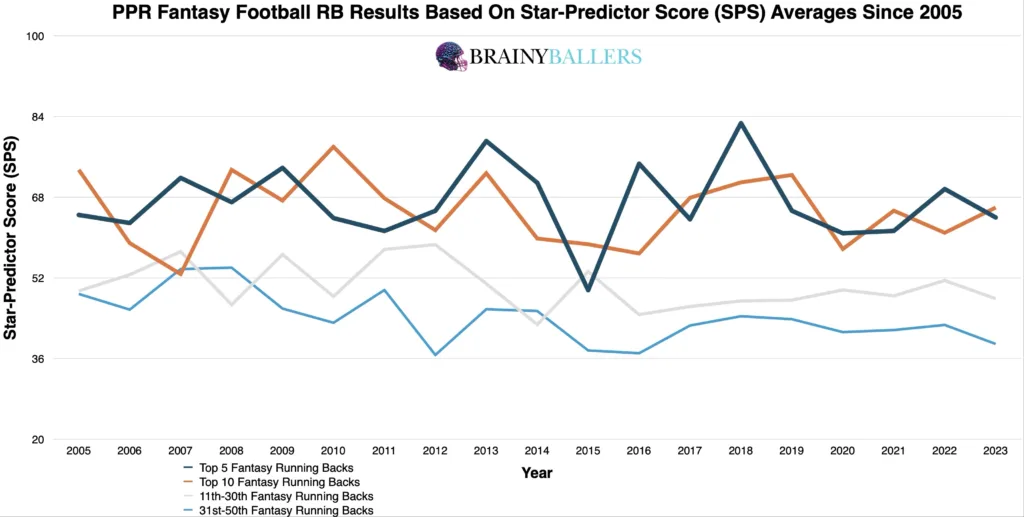
We began our study by charting average SPS scores of different leaderboard thresholds — the top 5, top 10, 11th-30th, and 31st-50th finishers annually since 2005. This revealed a trend that was clear and obvious: The top 10 finishers (dark blue line) consistently recorded higher SPS scores than those in the 31st-50th place finishers (light blue line), and by an average margin of 21.2 SPS. This chart is typically great at highlighting correlation or no-correlation metrics, like in the example with defensive end weights where no trend was visible in the averages chart, and weights ended up having zero correlation and therefore shouldn’t be used in scouting defensive ends. As for the SPS, the trend held firm over all 19 seasons, reinforcing the potential predictive power of the SPS.
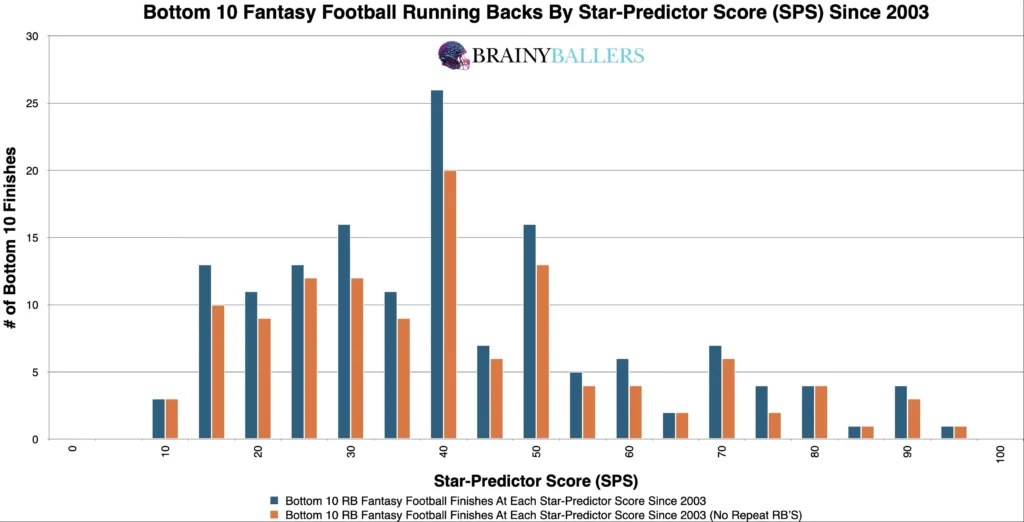
We next segmented the data out into 5.0 SPS increments to get a more granular visualization. This analysis further showed that higher SPS scores were more likely associated with higher fantasy football outcomes than lower ones. The weight and distribution of both these charts is how that can be seen, where you can will the top 10 first:
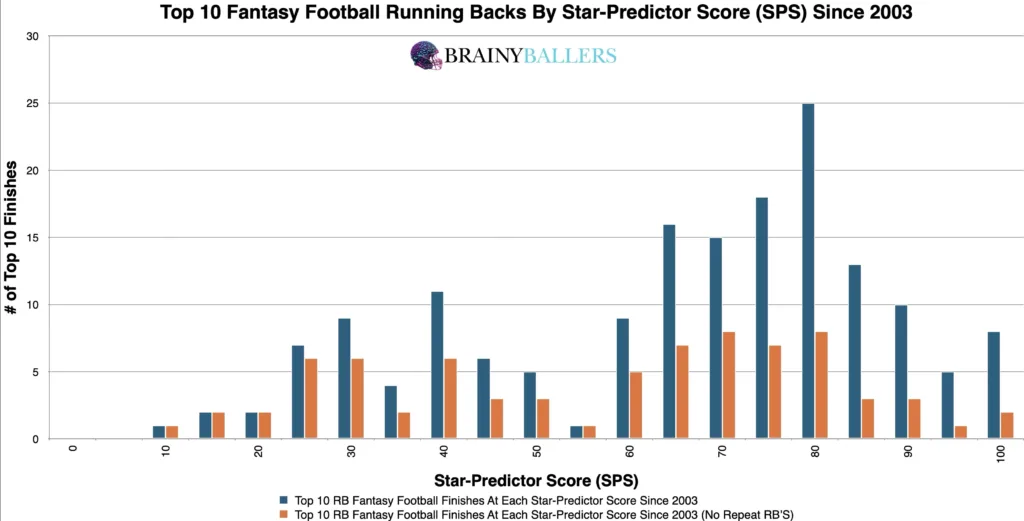
Our main quest was to find a threshold that correlates the most with top performing running backs while minimizing unique appearances (the one-hit wonders of the league). To identify this threshold, we constructed a differences chart that compared each Star-Predictor Score with the subsequent 5.0 SPS scores. We then subtracted the bottom 10 results from the top 10 within that group. The chart’s desired outcome is a negative number for unique differences (Orange) and a positive number for non-unique differences (Blue). This would indicate the top level consistency we are hoping for. From this, scores of roughly 55-60 and above consistently represented top performers. This insight got us close to an optimal threshold, which we will hone in on next.
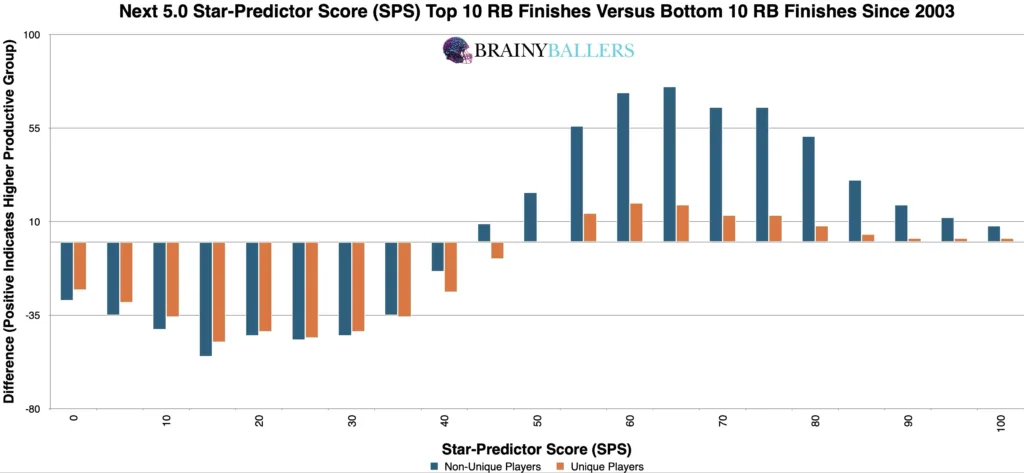
Armed with these initial findings, we further looked into the possible optimal range which our differences chart guided us towards. We tested various numbers close to the suggested range. In doing so, we discovered that setting the range to 60.0 and above resulted in a 51.7% higher appearance rate in the top 10 compared to the bottom 10. This range now stands as the ideal benchmark for evaluating top performers, and is what you should look for in prospects. This is now the highest producing optimal range for all metrics seen across all positions in our ultimate athlete blueprints. Although this is great, the next question is now how much does this matter?
With our optimal range established, we next wanted to utilize standard statistical methods to validate our insights. When comparing the Pearson value of the SPS in relation to fantasy points since 2003, here are those findings:
This indicates strong correlation between a RB’s Star-Predictor score (SPS) and their future fantasy production. When studying world class athletes as we are, we are hoping for a Pearson of above 0.1 or below -0.1. Comparatively, across 41 other metrics for Running Backs, the closest correlation recorded was 0.236 for Top All-Purpose yardage seasons, and draft capital at 0.234.
For those curious about the correlation coefficient when comparing draft capital and career fantasy points, and then comparing SPS grades to career fantasy points, here it is:
Now going down to all players in rounds 1-3:
As you can see, the gap of the significance difference closes when including the 3rd rounders, although it’s still more predictive. This gap continued to dwindle when including more rounds, although the SPS was still slightly more predictive than draft capital for all rounds and all UDFA since 2003. This is the reason only the top 3 NFL rounds will be published, with extra insights coming through rankings, social media, etc. Explaining the Pearson Value: Positive and negative Pearson values can be equally significant but in opposite ways. In the SPS example seen above, lower (higher value) overall draft capitals suggest a high probability of fantasy scoring, while higher SPS grades strongly indicate a higher fantasy score probability – and in a much more significant way than the draft capitals do.
Next, we compared data across decades to find whether the SPS is a growing or dying trend. In particular, we looked at the RB SPS optimal range amongst the top 10, 11th-40th, and bottom 10 fantasy finishers across the last two decades. This decadal differences chart indicated that the significance of this optimal range increased very slightly, but remained extremely significant in both decades, as seen by comparing the bottom 10 to the top 10 in both decades (blue), therefore meaning the SPS is a maintaining trend at the very least.
| 2004-2013 | |||
| Top 10 | 11 through 40 | Bottom 10 | |
| All count | 68 | 205 | 55 |
| All 60 and above | 47 | 85 | 11 |
| % (Optimal Range/all) | 69.1% | 41.5% | 20.0% |
| 2014-2023 | |||
| Top 10 | 11 through 40 | Bottom 10 | |
| All count | 99 | 294 | 95 |
| All 60 and above | 65 | 81 | 12 |
| % (Optimal Range/all) | 65.7% | 27.6% | 12.6% |
As far as the SPS table itself, users can filter and search data efficiently by applying parameters such as year, position, name, SPS scores, or colleges. The green cells in both SPS columns shows that the player is within the optimal range for future success chances. If you’re in green, you’re atop the bellcurve, with 100 being at the very top of the bell curve. The yellow indicates where the performance likelihood decline starts and transitions to red to indicate the players who are on the exponentially declining sides of the bellcurve. These tools and capabilities make it an invaluable asset for evaluating Running Back performances and finding sleepers or comparing player analytical profiles and future outlooks.

The Star-Predictor Score (SPS) is a scouting tool designed to maximize investment potential and reduce risks when drafting rookies in Fantasy Football. It is proven to have a higher accuracy than draft capital alone to predict fantasy success. The SPS includes 13 to 17 metrics, with the exact number varying by the player’s position. All these metrics are pre-NFL, and some are invented by us, providing a complete analysis of a player’s analytical profiles. The SPS gained widespread notoriety for its high accuracy, having made it on Barstool and The Pat McAfee Show. The SPS can be found here.
What 3 metrics matter the most when scouting a rookie Quarterback? What threshold should Quarterbacks achieve within those metrics to be considered an elite prospect? How much should you value those stats above all other stats? Couldn't answer those questions? Rest easy, we have it handled for you. That's what this chart answers. Sort by importance and/or filter by position. Unlock by signing up with the links provided. $9.99/Year or $24.99 Lifetime access. Cancel anytime.
Our research on the RB Star-Predictor Score (SPS) model uncovered the strongest correlation we’ve seen for any Running Back metrics, with a threshold that matches historical success patterns. A 60 or higher SPS grade is our benchmark for identifying top future RB talent. The SPS application can significantly enhance decision-making in drafting and acquiring players, offering a strategic edge to fantasy managers. Those fantasy managers can leverage this information to make data-driven choices, minimizing the risk of potential busts and enhancing team selection processes.
Our series has always sought to push the boundaries of sports analytics. This latest installment reaffirms our commitment to uncovering the hidden dynamics that define the game. Every Saturday, we’ll dive into intriguing questions, bust myths, and settle debates with thorough analysis. We welcome your input. Therefore, please leave comments or reach out with topics you’re eager to see dissected. All of our research can be found on our Analytics Page. Up next on our agenda for Part 53 of “Does It Matter?” is an examination of Tight End Star-Predictor Score (SPS): Does it matter? If so, what’s the SPS threshold necessary for NFL success? Mark your calendars; every Saturday we shed light on the topics that matter to you. All it takes is a quick question being asked and we will go to work for you!


BrainyBallers Buy-Hold-Sell Chart (All Players)
Get Your Products 100% Refunded By Predicting The Next SuperBowl Winner!
Brashard Smith Stats 😉 (if he rises any in the draft, he is definitely this years Bucky Irving. Congrats to anyone who sees this hidden message).
When evaluating talent for the NFL, analysts often look at a player’s college performance to predict their professional success. In our 64-part

In our 63-part analytical series, “Does It Matter?”, we next wanted to look into the intriguing question of whether a Tight End’s

For our 61 part “Does It Matter?” series, we looked into whether a Wide Receiver’s College Yards After Catch per Reception (YAC/Rec)
