Is Denzel Boston the Next Mike Evans? 2026 NFL Draft Scouting Report & SPS Grade
Is Denzel Boston the next Mike Evans? Our 2026 NFL Draft scouting report breaks down the WR prospect’s measurables, college production, and SPS grade.


For the 100th installment of our “Does It Matter?” series, we’re looking into whether Breakout Ages can help predict success for NFL Tight Ends. To figure out if this truly helps, we collected twenty years of data to see if early (or late) college production matters, how much it matters, and what optimal range you should look for in your favorite athlete.
To conduct this study, we analyzed the top 50 fantasy football finishers (PPR) for every season since 2003. All Breakout Ages were collected from PlayerProfiler.com.
Why the top 50? We chose the top 50 to find a “happy medium.” Including players further down the rankings would introduce fringe roster players who have no realistic path to the top 10, which would inevitably skew the data. Conversely, we needed a distinct “worst-to-best” contrast. By comparing the elite top 10 to the bottom 10 (the 41st–50th place finishers), we can clearly identify which metrics actually separate the benchwarmers from the league-winners.
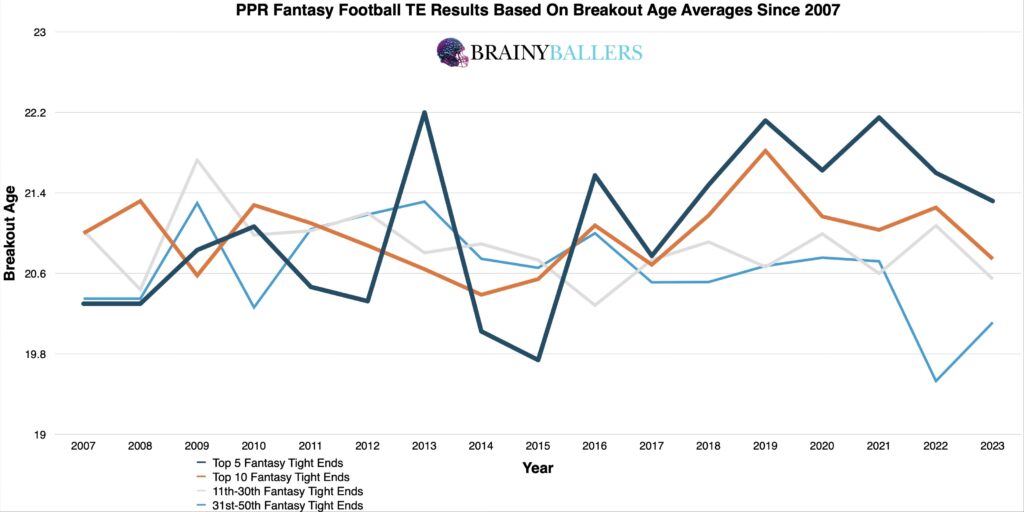
We first began by averaging the data from 2007 onwards for the Top 5, Top 10, 11th–30th, and 31st–50th place finishers. From this, a surprising trend emerged. Conventional wisdom has often suggested that the younger a player breaks out, the better. However, our data showed that higher Breakout Ages actually trended toward higher fantasy scores. Specifically, in 58.8% of the seasons (10 out of 17), the Top 5 finishers possessed higher average Breakout Ages than those finishing in the 31st–50th range. This suggests that either later breakouts are better or this metric is just noise.
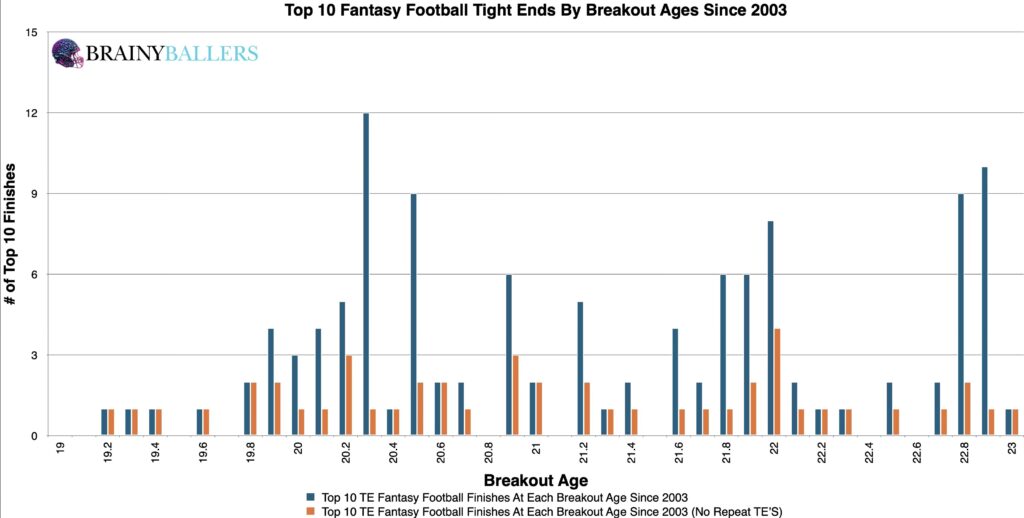
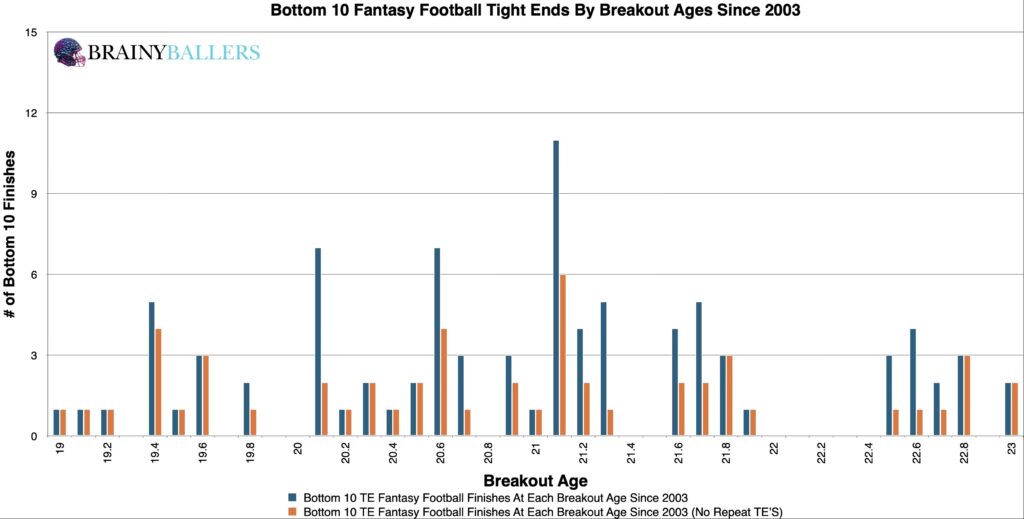
To help visualize the data, we charted top 10 finishers since 2003 segmenting them into buckets for every 0.1 Breakout Age increment. By comparing the weight and distribution of the top 10 charts against the bottom 10, the pattern was once again that higher Breakout Ages appeared to correlate more strongly with elite fantasy scores. The “density” of the top 10 shifted significantly toward the later breakout years when compared to the bottom 10 chart, which you can see both of those charts here:
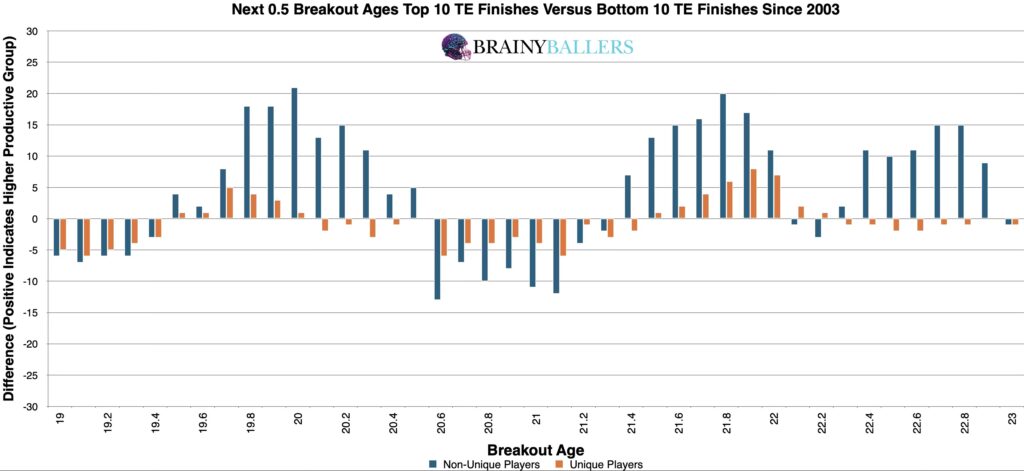
To move beyond averages and find an applicable threshold for top-level consistency, we developed a differences chart. This chart compares each Breakout Age along with a rolling window of the next 0.5 by subtracting the bottom 10 results from the top 10 within that group. The chart’s desired outcome is a negative number for unique differences (Orange) and a positive number for non-unique differences (Blue). This method helps minimize “outliers” or unique players, instead showcasing those who perform consistently. Initial results from this chart suggested that an optimal range could potentially be 21.4 and above, which we will test and verify next.
We further refined this data by testing various thresholds close to our initial findings to ensure we identified the highest-producing optimal range. Our spreadsheet testing revealed that a Breakout Age of 21.8 and above is the true sweet spot. This specific optimal range produces a 16.4% higher Top 10 appearance rate compared to the bottom 10. When evaluating your favorite athletes, this is the ideal threshold you should look for and will also be included in our Ultimate Athlete Blueprints which offers an easy-to-read table housing all of our researched metrics combined in one place for you to view as seen here:

Due to these findings, Breakout Ages could play a factor in our Star-Predictor Score (SPS) model. The Star-Predictor Score (SPS) is a scouting tool designed to maximize investment potential and reduce risks when drafting rookies in Fantasy Football. It is proven to have a higher accuracy than draft capital alone to predict fantasy football success. The SPS includes 13 to 17 metrics, with the exact number varying by the player’s position. All these metrics are pre-NFL – some of which are proprietary to BrainyBallers – providing a complete analysis of a player’s analytical profile. The SPS gained widespread notoriety for its high accuracy, having made it on Barstool and The Pat McAfee Show. The SPS can be found here, and future projected SPS grades can be unlocked here.

Don’t just draft for this year. Gain the knowledge needed to position yourself to secure your future with SPS rookie data.
We next wanted to test our data utilizing standard statistical methods. Specifically, the Pearson correlation coefficient.
This value indicates no linear correlation between breakout age and future fantasy production when applying traditional math across the entire dataset. We are hoping for a minimum of 0.1, or an inverse correlation maximum of -0.1 when studying world-class athletes as we are. For reference to something that everyone acknowledges matters in prospect scouting, and to show the accompanying Pearson value, QB draft capital prevailed a -0.219 Pearson value – meaning earlier drafted QB’s perform better.
Finally, we compared decades to see if this metric is losing or gaining steam. Our decadal differences chart shows that the 21.8+ optimal range is actually an increasing trend in the most recent decade. For modern Top 10 finishers, a later breakout age is becoming an even more significant indicator of success compared to the mid-tier (11th–40th) and bottom 10 finishers.
| 2004-2013 | |||
| Top 10 | 11 through 40 | Bottom 10 | |
| All count | 42 | 98 | 30 |
| All 21.8 and above | 12 | 22 | 8 |
| % (Optimal Range/all) | 28.6% | 22.4% | 26.7% |
| 2014-2023 | |||
| Top 10 | 11 through 40 | Bottom 10 | |
| All count | 90 | 237 | 70 |
| All 21.8 and above | 36 | 48 | 12 |
| % (Optimal Range/all) | 40.0% | 20.3% | 17.1% |
Ultimately, the data suggests that Tight End Breakout Age does not matter as a universal predictive tool as evidenced by the low correlation in our coefficient analysis. However, if you still choose to weigh this metric in your evaluations, you must move away from the “younger is better” narrative. To find any actual signal in the noise, you need to target the optimal range of 21.8 and above, which remains the only segment that consistently separates elite TE1s from the rest of the pack.


BrainyBallers Buy-Hold-Sell Chart (All Players)
Is Denzel Boston the next Mike Evans? Our 2026 NFL Draft scouting report breaks down the WR prospect’s measurables, college production, and SPS grade.

Is KC Concepcion the next Deebo Samuel? Our 2026 NFL Draft scouting report breaks down the WR’s measurables, college production, and SPS grade.

Is Carnell Tate the next Justin Jefferson? Our 2026 NFL Draft scouting report breaks down the WR prospect’s measurables, college production, and SPS grade