
Tight Ends: Can College Yardage Help Predict NFL Success?
When evaluating talent for the NFL, analysts often look at a player’s college performance to predict their professional success. In our 64-part


In the 43rd Part of our “Does It Matter?” series, we dove into the statistical relationship between a wide receiver’s college yards per route run (Y/RR) and their success in the NFL. By using data since 2018, we found an optimal range for Y/RR which you can apply to your prospect scouting tool bag. This analysis is highly beneficial for deciding between two players or assessing an individual player, but it shouldn’t be viewed as a sole predictor of a player’s potential for success or failure. Here are all of our findings:
For this study, we examined the top 50 fantasy football finishers each year since 2018, based on PPR (Point Per Reception) fantasy scores. The “bottom 10”, which you will see throughout this study, refers to fantasy finishers ranked 41st to 50th each season. It is worthwhile to note the limited dataset—42 entries for the top 10 and 239 for all athletes since 2018—indicating that trends found within this article may only be the beginning of a more concrete understanding of the Y/RR’s predictive power.
Why the top 50? By limiting our analysis to the top 50 fantasy finishers, we maintained a “happy medium”. Choosing the bottom 10—players ranking 41st-50th—was a deliberate choice to contrast between the best and the rest. 41st-50th place finishers won’t include fringe roster players who would only skew data, although we can truly separate between the “best” and the “bottom” by going down to the 41st-50th place finishers.
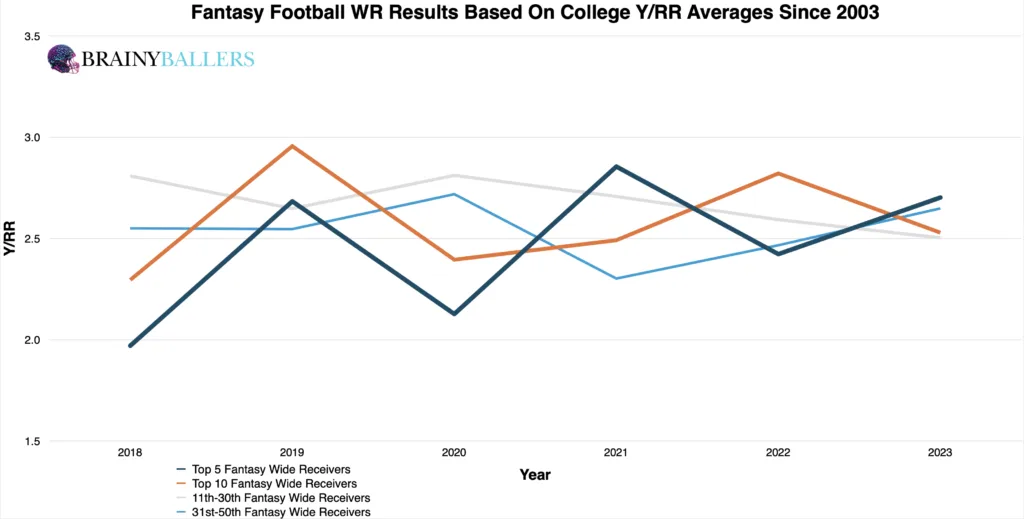
One of our first methods involved creating an averages chart that categorized fantasy finishers into the top 5, top 10, 11th-30th, and 31st-50th place finishers since 2018. The results from this prevailed no notable trend. As you can see, the top 5 finishers boasted a higher Y/RR compared to those finishing between 31st and 50th in 50% of seasons, creating a toss-up situation.
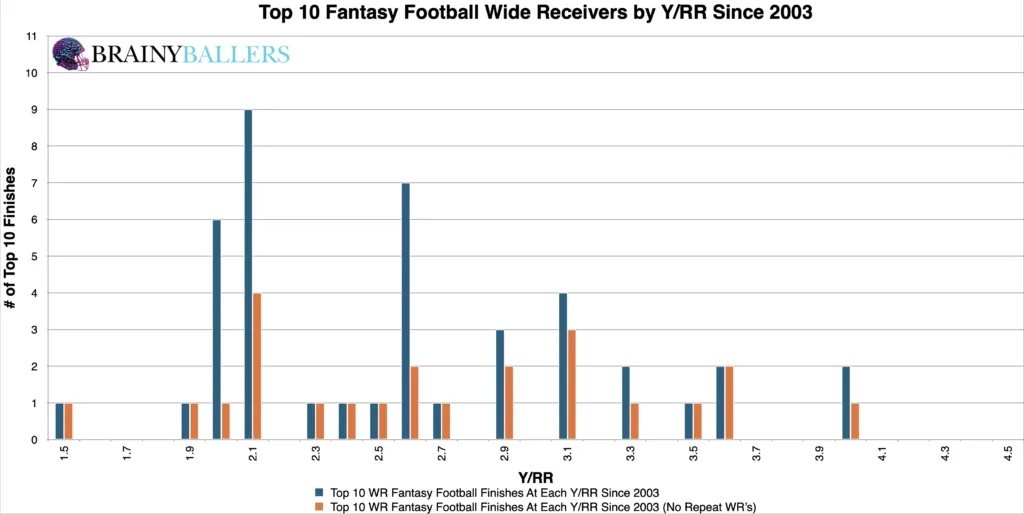
To look deeper, we segmented top 10 finishers’ Y/RR into 0.1 rounded increments. Interestingly, these charts indicated a tendency towards lower Y/RR among top performers, contradicting the assumption that higher Y/RR would correlate with higher NFL performances. Those charts can be seen below, with the top 10 first:
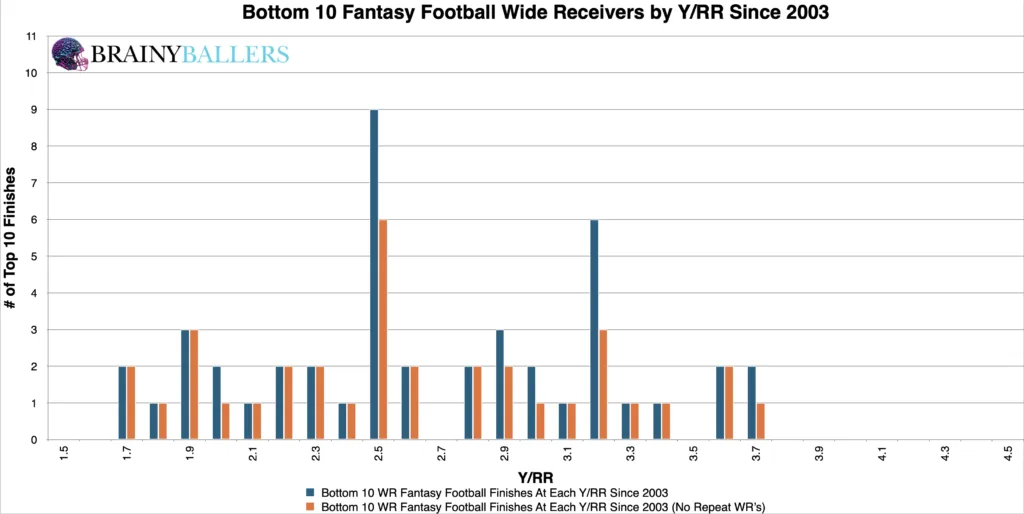
To achieve finding an optimal range where the highest increase of performances occur, we created our differences chart for this data set. This compares each Y/RR increment, along with the next 0.3 (rounded to the nearest 0.1), subtracting the bottom 10 from the top 10. The chart’s desired outcome is a negative number for unique differences (Orange) and a positive number for non-unique differences (Blue). This would indicate the top level consistency we are hoping for. This allowed us to identify the possible optimal range of 1.8 to 2.4 Y/RR, which we will verify next.
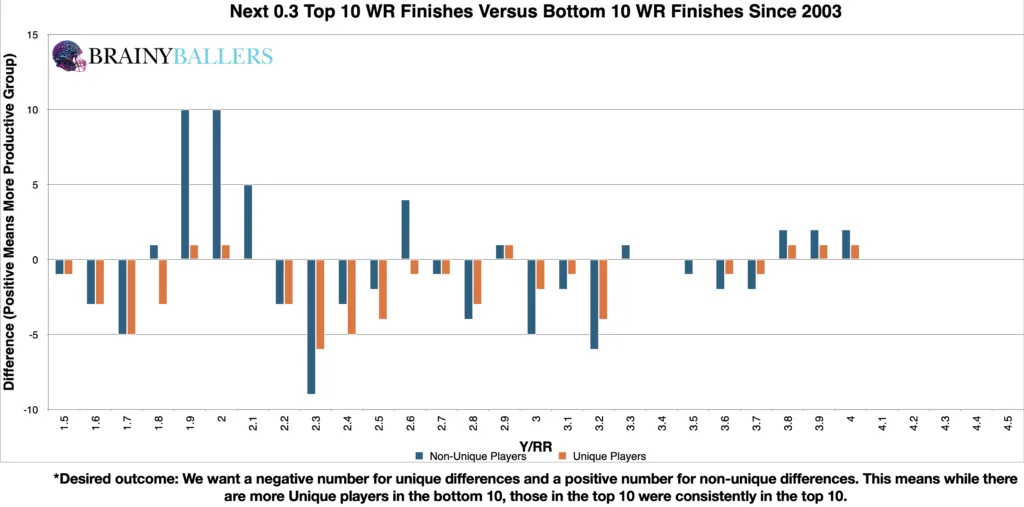
The possible Y/RR range of 1.8 to 2.4 seems to provide peak performance telling buy our differences chart. However, by adjusting this range to several nearby ranges, we narrowed down the range to a more precise 1.96 to 2.45 Y/RR. This modified range produced a 23.1% higher appearance rate in the top 10 compared to the bottom 10. As a result, this range will be the basis of this study going forward, and will be the optimal range for WR College Y/RR in our Ultimate Athlete Blueprints.
Due to these findings, Y/RR could play a factor in our Star-Predictor Score (SPS) model. Since 1.51 Y/RR is the lowest seen since 2003 in the top 10, this will be the critical value for the SPS. The Star-Predictor Score (SPS) is a scouting tool designed to maximize investment potential and reduce risks when drafting rookies in Fantasy Football. It is proven to have a higher accuracy than draft capital alone to predict fantasy success. The SPS includes 13 to 17 metrics, with the exact number varying by the player’s position. All these metrics are pre-NFL, and some are invented by us, providing a complete analysis of a player’s analytical profiles. The SPS gained widespread notoriety for its high accuracy, having made it on Barstool and The Pat McAfee Show. The SPS can be found here.
Our next tactic included employing standard statistical methods to affirm or reject correlations. We looked at the Pearson value in this data, which can be seen next:
This figure represents no correlation between a wide receiver’s Y/RR and their fantasy production. We are hoping for a minimum of 0.1, or an inverse correlation maximum of -0.1 when we study world-class athletes as we are. For reference to something that everyone acknowledges matters in prospect scouting, and to show the accompanying Pearson value, QB draft capital prevailed a -0.219 Pearson value.
What 3 metrics matter the most when scouting a rookie Quarterback? What threshold should Quarterbacks achieve within those metrics to be considered an elite prospect? How much should you value those stats above all other stats? Couldn't answer those questions? Rest easy, we have it handled for you. That's what this chart answers. Sort by importance and/or filter by position. Unlock by signing up with the links provided. $9.99/Year or $24.99 Lifetime access. Cancel anytime.
By analyzing College Y/RR values and applying standard statistical methods, we established that Y/RR for incoming NFL Wide Receivers should have little weight in evaluating who we should draft or who we should shy away from. If you still wish to believe in this metric, 1.96 to 2.45 Y/RR is the range you should be hoping for in your favorite athletes.
Our series has always sought to push the boundaries of sports analytics. This latest installment reaffirms our commitment to uncovering the hidden dynamics that define the game. Every Saturday, we’ll dive into intriguing questions, bust myths, and settle debates with thorough analysis. We welcome your input. Therefore, please leave comments or reach out with topics you’re eager to see dissected. All of our research can be found on our Analytics Page. Up next on our agenda for Part 44 of “Does It Matter?” is an examination of Running Back College Yards Per Carry (YPC): Does it matter? If so, what’s the YPC threshold necessary for NFL success? Mark your calendars; every Saturday we shed light on the topics that matter to you. All it takes is a quick question being asked and we will go to work for you!


BrainyBallers Buy-Hold-Sell Chart (All Players)
Get Your Products 100% Refunded By Predicting The Next SuperBowl Winner!
When evaluating talent for the NFL, analysts often look at a player’s college performance to predict their professional success. In our 64-part

In our 63-part analytical series, “Does It Matter?”, we next wanted to look into the intriguing question of whether a Tight End’s

For our 61 part “Does It Matter?” series, we looked into whether a Wide Receiver’s College Yards After Catch per Reception (YAC/Rec)
