
Tight Ends: Can College Yardage Help Predict NFL Success?
When evaluating talent for the NFL, analysts often look at a player’s college performance to predict their professional success. In our 64-part


For our “Does It Matter?” series, Part 42, we dove into the question of whether there is correlation between a wide receiver’s draft capital and their NFL success. Our analysis used historical data since 2003 to attempt to identify patterns that may have predictive power. This analysis is particularly valuable for comparing two players or evaluating a single player, but it shouldn’t be considered a definitive predictor of a player’s success or failure potential. Here’s all of our findings:
For this study, we focused on the top 50 fantasy football finishers each year since 2003, using PPR (Points Per Reception) fantasy scores. Throughout this study, the “bottom 10” will refer to players who finished between 41st and 50th in fantasy rankings each season.
Why the top 50? Choosing the top 50 fantasy performers allowed us to maintain a “happy medium” by avoiding the fringe roster players who rarely are likely to achieve top 10 performances. Although, going from the top 10 to the 41st-50th place finishers allowed us to examine truly the “best” and “worst” performers, while steering clear of the mid-range finishers.
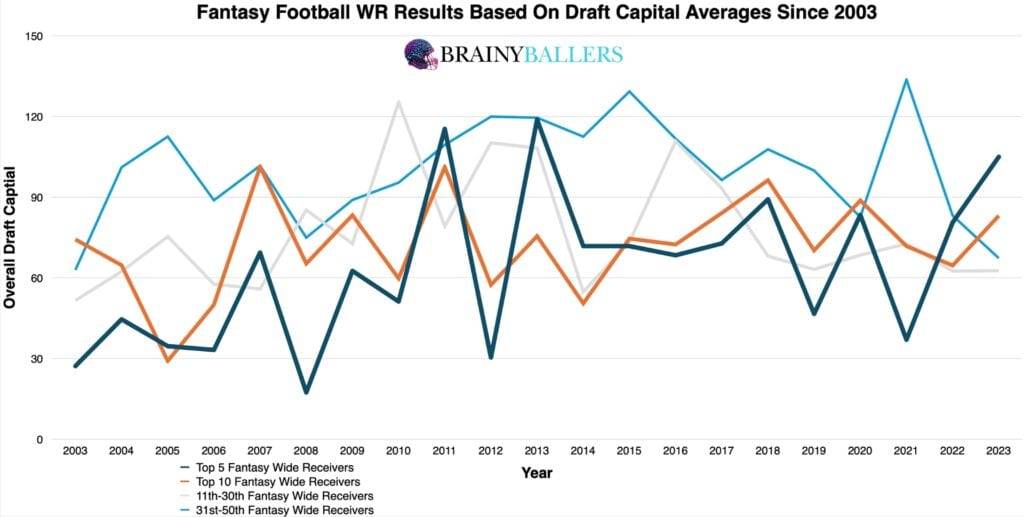
To start, we created an averages chart which categorizes top fantasy finishers into 5 different groups: top 5, top 10, 11th-30th, and 31st-50th place. Across 19 out of 21 seasons (90.5%), top 5 finishers had similar or higher draft capital than the 31st-50th group. This suggests a strong correlation between higher draft positions and better fantasy performances.
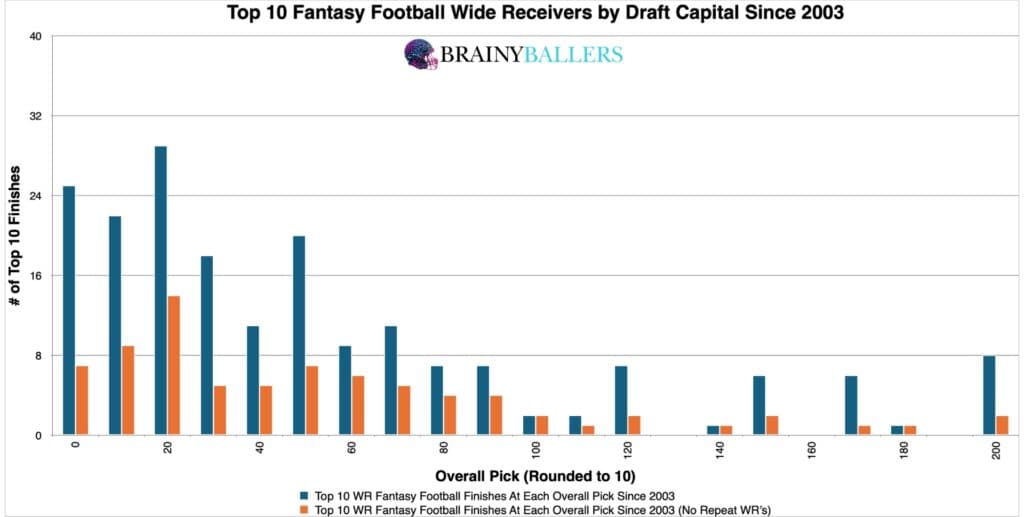
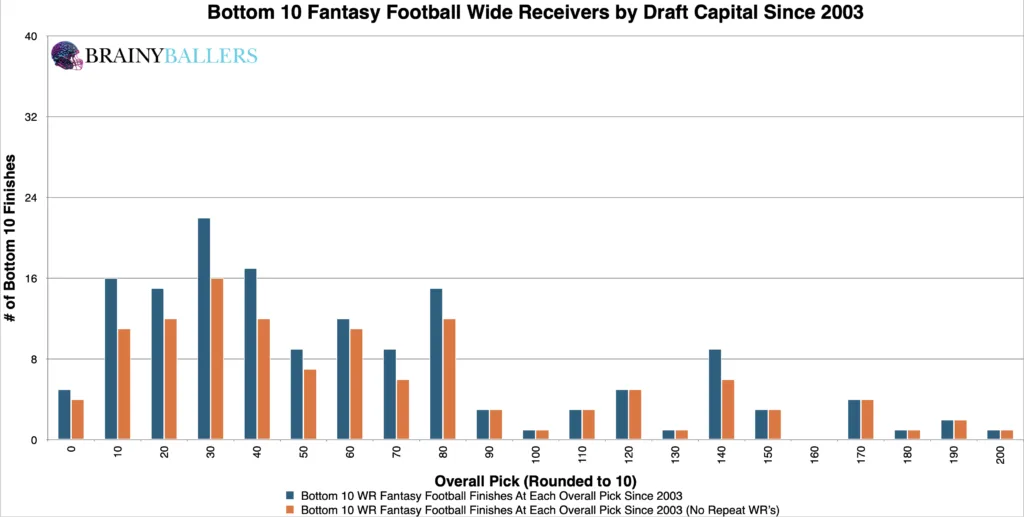
Further, we segmented the top and bottom 10 finishers into 10 overall pick increments, rounded to the nearest 10. This revealed a trend where lower draft capital were more prevalent among top performers.
To find where the highest increase in performance occurs and where the least unique players emerge (indicating consistency), we developed a differences chart. This chart compares each draft capital plus the next 30 overall picks, subtracting the bottom 10 results from the top 10. The chart’s desired outcome is a negative number for unique differences (Orange) and a positive number for non-unique differences (Blue). This would indicate the top level consistency we are hoping for. From this, we identified the 50th overall pick and below as a possible range for consistent high performances. We will next attempt to verify or debunk this range.
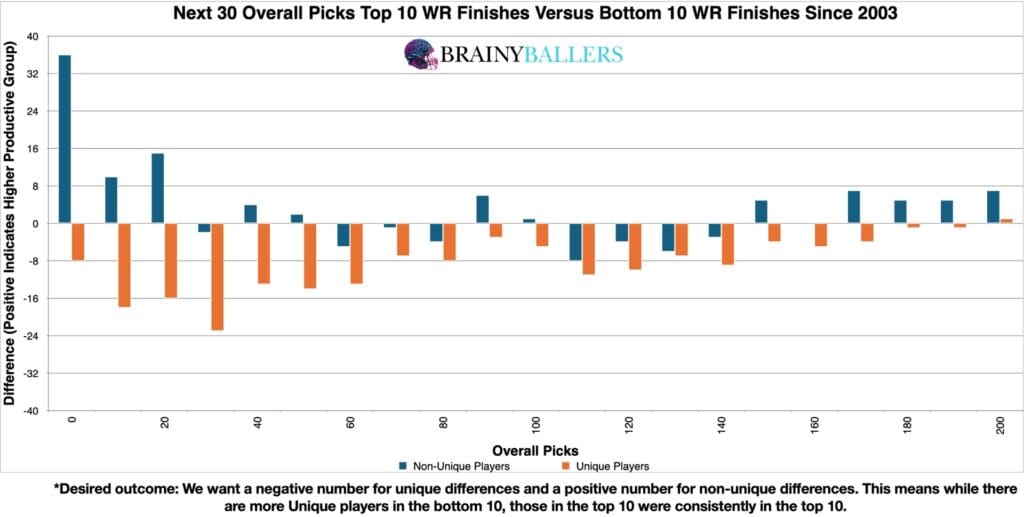
To ensure maximum accuracy, we adjusted the range to attempt to identify the highest producing one in our spreadsheet. By testing various numbers around our initial findings, we discovered that the 70th overall pick (rounded to nearest 10) and below yields an 18.8% higher appearance rate in the top 10 compared to the bottom 10. This refined range will be the focus of this study going forward, and will be our optimal range for WR draft capital.
Due to these findings, draft capital could play a factor in our Star-Predictor Score (SPS) model. Since UDFA is the lowest seen since 2003 in the top 10, there will not be a critical value for the SPS in regards to draft capital. The Star-Predictor Score (SPS) is a scouting tool designed to maximize investment potential and reduce risks when drafting rookies in Fantasy Football. It is proven to have a higher accuracy than draft capital alone to predict fantasy success. The SPS includes 13 to 17 metrics, with the exact number varying by the player’s position. All these metrics are pre-NFL, and some are invented by us, providing a complete analysis of a player’s analytical profiles. The SPS gained widespread notoriety for its high accuracy, having made it on Barstool and The Pat McAfee Show. The SPS can be found here.
Using standard statistical methods, we calculated a Pearson Value of -0.142, indicating a strong correlation between draft capital and fantasy production. We are hoping for a minimum of 0.1, or an inverse correlation maximum of -0.1 when we study world-class athletes as we are. For reference to something that everyone acknowledges matters in prospect scouting, and to show the accompanying Pearson value, QB draft capital prevailed a -0.219 Pearson value.
To assess whether this is a recent or dying trend, we compared the last two decades in terms of our identified WR Draft Capital range for the top 10, 11th to 40th place finishers, and the bottom 10. This chart revealed that the optimal range has remained relatively consistent over time, reinforcing the validity of our findings.
| 2004-2013 | |||
| Top 10 | 11 through 40 | Bottom 10 | |
| All count | 100 | 298 | 99 |
| All 70 and below | 71 | 172 | 49 |
| % (Optimal Range/all) | 71.0% | 57.7% | 49.5% |
| 2014-2023 | |||
| Top 10 | 11 through 40 | Bottom 10 | |
| All count | 100 | 300 | 100 |
| All 70 and below | 66 | 191 | 49 |
| % (Optimal Range/all) | 66.0% | 63.7% | 49.0% |
What 3 metrics matter the most when scouting a rookie Quarterback? What threshold should Quarterbacks achieve within those metrics to be considered an elite prospect? How much should you value those stats above all other stats? Couldn't answer those questions? Rest easy, we have it handled for you. That's what this chart answers. Sort by importance and/or filter by position. Unlock by signing up with the links provided. $9.99/Year or $24.99 Lifetime access. Cancel anytime.
Our study highlighted a correlation between draft capital and fantasy football success for wide receivers. While anomalies obviously will exist, high draft capital generally correlates with higher fantasy rankings. You should focus on players drafted anywhere from the 75th pick and earlier. This range includes the 1st round up to just before the midpoint of the 3rd round.
Our series has always sought to push the boundaries of sports analytics. This latest installment reaffirms our commitment to uncovering the hidden dynamics that define the game. Every Saturday, we’ll dive into intriguing questions, bust myths, and settle debates with thorough analysis. We welcome your input. Therefore, please leave comments or reach out with topics you’re eager to see dissected. All of our research can be found on our Analytics Page. Up next on our agenda for Part 43 of “Does It Matter?” is an examination of Wide Receiver College Yards Per Route Run (Y/RR): Does it matter? If so, what’s the Y/RR threshold necessary for NFL success? Mark your calendars; every Saturday we shed light on the topics that matter to you. All it takes is a quick question being asked and we will go to work for you!


BrainyBallers Buy-Hold-Sell Chart (All Players)
Get Your Products 100% Refunded By Predicting The Next SuperBowl Winner!
When evaluating talent for the NFL, analysts often look at a player’s college performance to predict their professional success. In our 64-part

In our 63-part analytical series, “Does It Matter?”, we next wanted to look into the intriguing question of whether a Tight End’s

For our 61 part “Does It Matter?” series, we looked into whether a Wide Receiver’s College Yards After Catch per Reception (YAC/Rec)
