Can A Tight End’s 10-Yard Split Help Predict Their NFL Success?
In our extensive 65-part “Does It Matter?” series, we have explored various metrics to gauge their effectiveness in predicting an NFL player’s


In Part 22 of our “Does It Matter?” series, we look into the question of whether weight can be a predictor of success for NFL Tight Ends. By crunching the numbers, we hoped to uncover patterns and trends that could provide valuable insights. Here are all of our findings:
To maintain consistency in our data, we exclusively used NFL Combine numbers. Our dataset was of the top 50 PPR (Points Per Reception) fantasy football finishers annually since 2003.
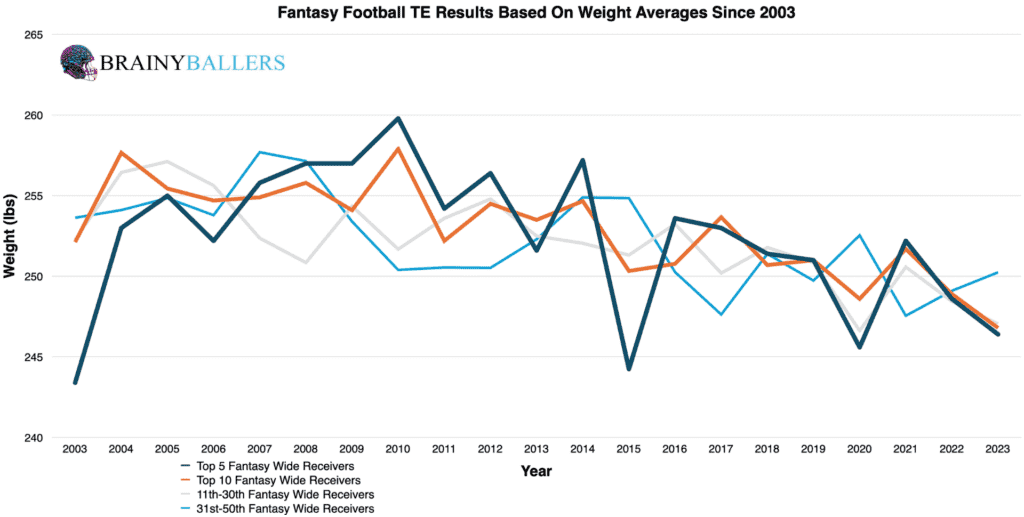
To begin, we created an averages chart. This would hopefully enable us to visualize the data on a broad level to start to identify any trends. This chart covered average weights for different categories of finishers. Here are the categories we are looking at:
Despite our effort, finding clear trends from this chart was not easy. The data did not show any notable differences in average weight between the top and bottom performers, leading us to dig deeper and segmenting the data out even further, which you will see next.
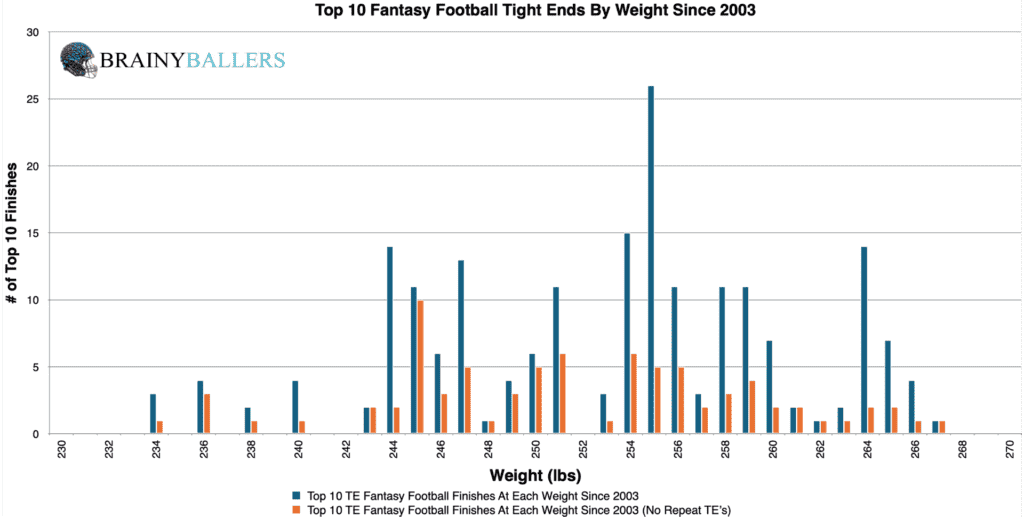
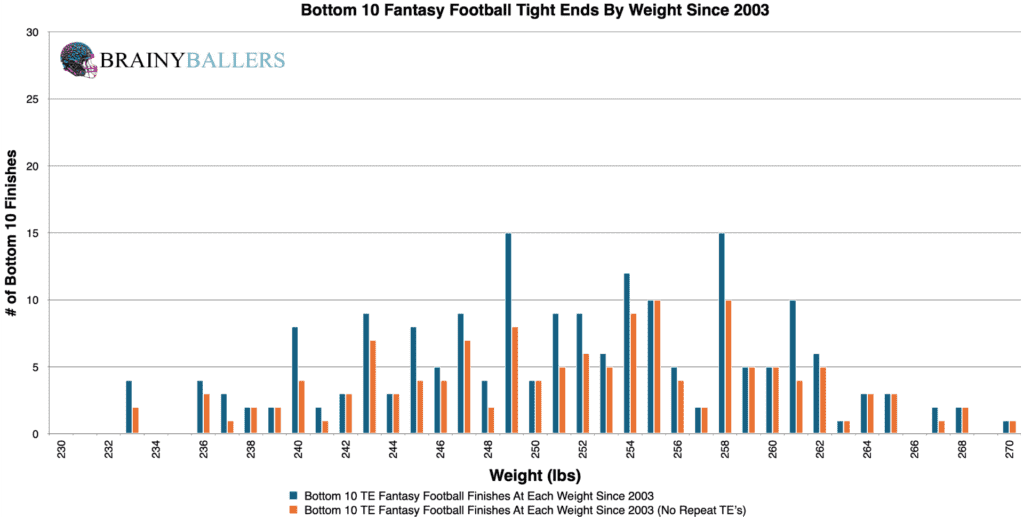
To seek further insights, we segmented the top 10 finishers by 1-pound increments. This approach will allow us to observe weight distributions more closely among the highest and lowest performers. It was hard to identify a definitive trend, although it does appear that there is a very slight trend of higher weights trending slightly towards higher weights. Here are those charts, with the top 10 chart first:
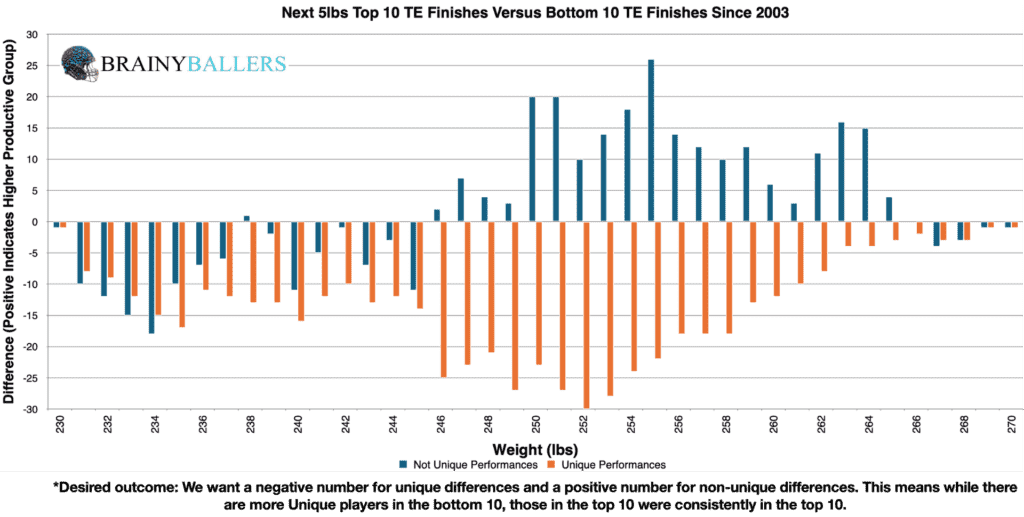
Our next objective was to pinpoint an applicable weight threshold for NFL Tight Ends where the highest increase in performance occurs while maintaining top-level consistency with fewer unique players. For this, we constructed a differences chart comparing each weight plus the next 5- pounds by subtracting the bottom 10 results from the top 10. The chart’s desired outcome is a negative number for unique differences (Orange) and a positive number for non-unique differences (Blue). This would indicate the desired consistent top level performances we are hoping for. The findings suggest that TEs in the range of 246-270lbs exhibit top performance. This gets us closer to identifying a possible threshold, or range of top performing Tight Ends.
To attempt to validate our hypothesis, we analyzed this weight range among TEs who finished in the bottom 10 since 2003. Out of 204 TEs, 143 were within the 246-270lbs range, accounting for 70.1%. This serves as the baseline for our comparison against top 10 finishers to determine if we identified an average TE weight, or an average top-performing TE weight. That breakdown will be next:
Among all top 10 finishers between 2003-2023, 159 out of 202 were in the 246-270lbs range, accounting for 78.7%. This reflects an 8.6% increase compared to the baseline, indicating a potential identification of the top-performing TE weight. Although this is great, we wanted to fine-tune the range to attempt to find the actual highest producing range, which will be seen next:
To ensure we have the highest producing range, we upgraded our spreadsheet for quick range adjustments. From this, we were able to identify and verify the optimal weight range for top performances. Testing various ranges close to our initial range revealed that 244-266lbs occurs 17.6% more often in the top 10 than the bottom 10. This refined range will be the focus of this study going forward.
Due to these findings, weight could play a factor in our Star-Predictor Score (SPS) model. Since 221lbs is the lowest seen since 2003 in the top 10, this will be the critical value for the SPS in regards. The Star-Predictor Score (SPS) is a scouting tool designed to maximize investment potential and reduce risks when drafting rookies in Fantasy Football. It is proven to have a higher accuracy than draft capital alone to predict fantasy success. The SPS includes 13 to 17 metrics, with the exact number varying by the player’s position. All these metrics are pre-NFL, and some are invented by us, providing a complete analysis of a player’s analytical profiles. The SPS gained widespread notoriety for its high accuracy, having made it on Barstool and The Pat McAfee Show. The SPS can be found here.
To add another layer of statistical analysis to our study, we evaluated the correlation between weight and fantasy performances using standard methods. Those findings are as follows:
This Pearson Value indicates no significant correlation. We are hoping for a minimum of 0.1, or an inverse correlation maximum of -0.1 when we study world-class athletes as we are. For reference to something that everyone acknowledges matters in prospect scouting, and to show the accompanying Pearson value, RB draft capital prevailed a -0.234 Pearson value.
By breaking down the data into top 10, 11-40th place, and bottom 10 finishers across the last 2 decades and applying our optimal weight range (244-266lbs), we could spot patterns or shifts. Interestingly, our findings reveal a decrease in the prevalence of TEs within our optimal range in the most recent decade. As you can see, there is a 15.8% drop in the rate at which TEs within this optimal range appeared in the top 10 compared to their presence in the bottom 10, when contrasted with the previous decade.
| 2004-2013 | |||
| Top 10 | 11 through 40 | Bottom 10 | |
| All count | 98 | 287 | 99 |
| All between 244-266lbs | 96 | 240 | 70 |
| % (Optimal Range/all) | 98.0% | 83.6% | 70.7% |
| 2014-2023 | |||
| Top 10 | 11 through 40 | Bottom 10 | |
| All count | 96 | 286 | 96 |
| All between 244-266lbs | 81 | 225 | 70 |
| % (Optimal Range/all) | 84.4% | 78.7% | 72.9% |
What 3 metrics matter the most when scouting a rookie Quarterback? What threshold should Quarterbacks achieve within those metrics to be considered an elite prospect? How much should you value those stats above all other stats? Couldn't answer those questions? Rest easy, we have it handled for you. That's what this chart answers. Sort by importance and/or filter by position. Unlock by signing up with the links provided. $9.99/Year or $24.99 Lifetime access. Cancel anytime.
Our analysis suggests that while weight alone isn’t a definitive predictor of NFL TE success, there is an optimal range that top performers more frequently fell within. That range happens to be 244-266lbs, which indicates a higher potential for future top-performing TEs.
Our series has always sought to push the boundaries of sports analytics. This latest installment reaffirms our commitment to uncovering the hidden dynamics that define the game. Every Saturday, we’ll dive into intriguing questions, bust myths, and settle debates with thorough analysis. We welcome your input. Therefore, please leave comments or reach out with topics you’re eager to see dissected. All of our research can be found on our Analytics Page. Up next on our agenda for Part 23 of “Does It Matter?” is an examination of TE RAS: Does it matter? If so, what’s the RAS threshold necessary for success? Mark your calendars; every Saturday we shed light on the topics that matter to you. All it takes is a quick question being asked and we will go to work for you!


BrainyBallers Buy-Hold-Sell Chart (All Players)
Get Your Products 100% Refunded By Predicting The Next SuperBowl Winner!
In our extensive 65-part “Does It Matter?” series, we have explored various metrics to gauge their effectiveness in predicting an NFL player’s

When evaluating talent for the NFL, analysts often look at a player’s college performance to predict their professional success. In our 64-part

In our 63-part analytical series, “Does It Matter?”, we next wanted to look into the intriguing question of whether a Tight End’s
