Can A Tight End’s 10-Yard Split Help Predict Their NFL Success?
In our extensive 65-part “Does It Matter?” series, we have explored various metrics to gauge their effectiveness in predicting an NFL player’s


In our 63-part analytical series, “Does It Matter?”, we next wanted to look into the intriguing question of whether a Tight End’s draft capital can help predict future success in fantasy football. While not a definitive predictor of bust or success, the information found within this article can be used to enhance the decision-making process but should not be used as the only reason someone likes a player. Here are all of our findings:
To structure our study, we focused on the top 50 fantasy football finishers since 2003, using PPR (Points Per Reception) fantasy scores. Our analysis segmented the players based on their draft capital and compared their performances in terms of fantasy points each season. In this article, the “bottom 10” refers to players who finished 41st-50th each season.
Why The Top 50? The decision to limit our analysis to the top 50 finishers was made due to the worry that including players beyond this range would have introduced fringe roster players, skewing the data’s relevance. Conversely, by looking at the top 10, avoiding the 11th-40th place finishers, and focusing on the 41st-50th range, we were still able to compare the actual best and worst.
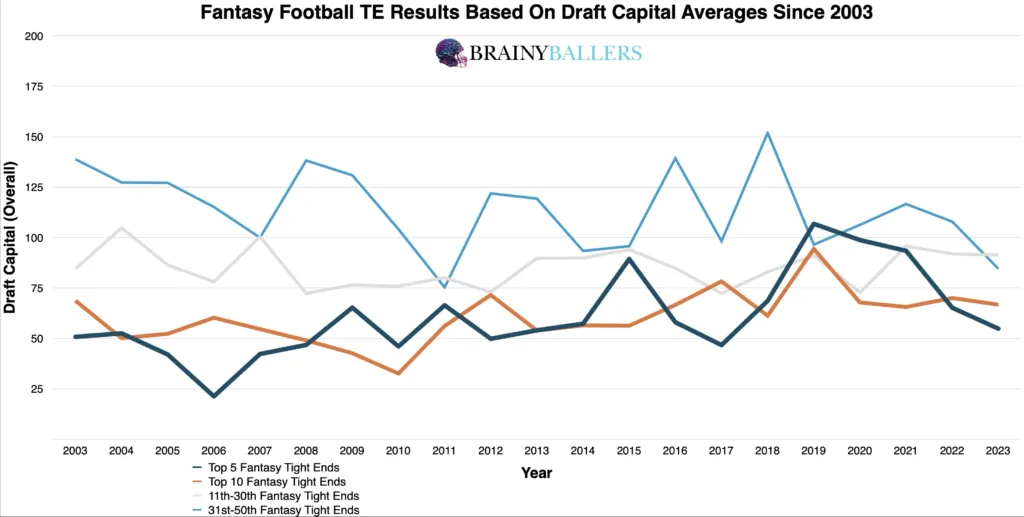
To begin, we examined averages for the top 5, 10, 11-30th, and 31-50th place finishers since 2003. This gave us the ability to visually see where the averages of the different finisher groups finished in terms of draft capital. This revealed that lower picks typically correlated with higher NFL fantasy scores. Specifically, during 20/21 (95.2%) seasons, the top 5 finishers had lower draft capitals compared to those in the 31st-50th place finishers group. This suggests that picking a tight end earlier typically translates to greater production.
We next charted top 10 finishers since 2003, rounding their draft positions into 10 overall pick increments. The weight and distribution of these charts showed the trend of lower draft capitals consistently being associated with higher fantasy outputs. These charts can be compared to come to that conclusion, with the top 10 coming first:
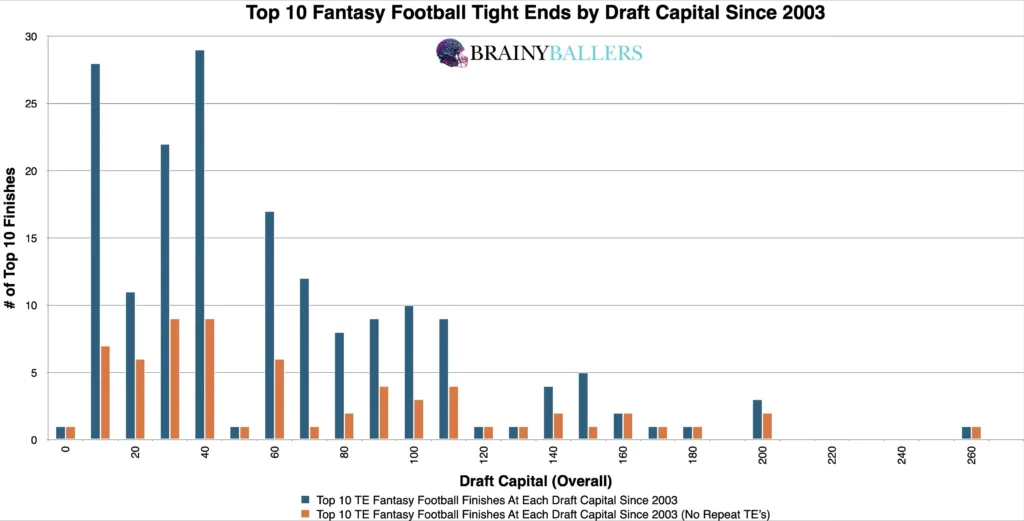
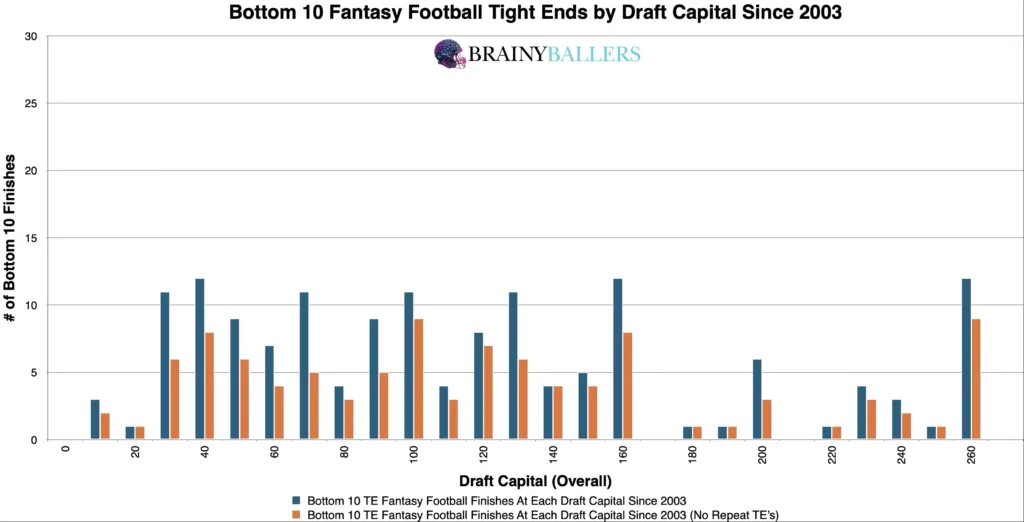
Our main goal was to find a threshold where the top performers were drafted more often than the bottom 10. Further, we were hoping for a range where fewer unique players appear, indicating top-level consistency. For this, we developed a differences chart that compares each draft capital plus the next 20 overall picks, subtracting the bottom 10 from the top 10. The chart’s desired outcome is a negative number for unique differences (Orange) and a positive number for non-unique differences (Blue). This would indicate the top level consistency we are hoping for. From this chart, it appears as though 110th overall and below appears to be the top producing threshold, which gets us closer to an optimal range, but we will still verify or debunk this next.
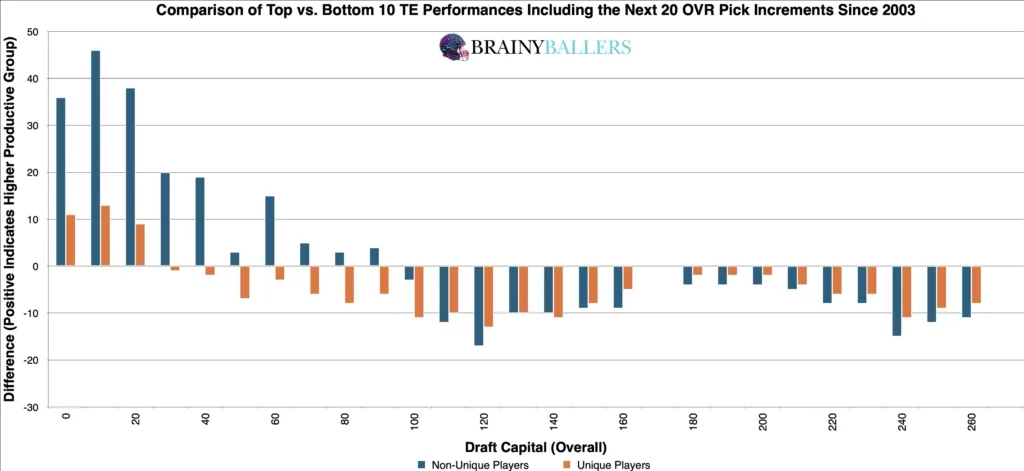
Our differences chart suggested that an overall draft position of 110th and below marked a possible optimal range, possibly indicating peak performance. By using our dataset, we were able to adjust this to verify that a range of 110th overall and below yields the highest producing range, resulting in a 34.9% higher top 10 appearance rate compared to the bottom 10. Therefore, this is what you should look for in athletes, and will be the optimal range. After removing the rounding, this becomes 115th overall and below.
Due to these findings, draft capital could play a factor in our Star-Predictor Score (SPS) model. Since UDFA is the lowest draft capital seen since 2003 in the top 10, that will be the critical value in the SPS. The Star-Predictor Score (SPS) is a scouting tool designed to maximize investment potential and reduce risks when drafting rookies in Fantasy Football. It is proven to have a higher accuracy than draft capital alone to predict fantasy success. The SPS includes 13 to 17 metrics, with the exact number varying by the player’s position. All these metrics are pre-NFL, and some are invented by us, providing a complete analysis of a player’s analytical profiles. The SPS gained widespread notoriety for its high accuracy, having made it on Barstool and The Pat McAfee Show. The SPS can be found here.
By applying a standard statistical analysis, we found a Pearson correlation value of -0.270. This implies a strong inverse relationship between a tight end’s draft capital and their fantasy success. We are hoping for a minimum of 0.1, or an inverse correlation maximum of -0.1 when we study world-class athletes as we are. For reference to something that everyone acknowledges matters in prospect scouting, and to show the accompanying Pearson value, QB draft capital prevailed a -0.219 Pearson value.
To solidify our hypothesis, we compared draft capital impacts over decades, examining top 10, 11-40th place finishers, and bottom 10. Our decadal differences chart found that while the optimal range’s significance has lessened slightly, it remains a strong trend in evaluating tight end potential.
| 2004-2013 | |||
| Top 10 | 11 through 40 | Bottom 10 | |
| All count | 84 | 251 | 74 |
| All 115 and below | 80 | 175 | 40 |
| % (Optimal Range/all) | 95.2% | 69.7% | 54.1% |
| 2014-2023 | |||
| Top 10 | 11 through 40 | Bottom 10 | |
| All count | 86 | 241 | 70 |
| All 115 and below | 72 | 166 | 38 |
| % (Optimal Range/all) | 83.7% | 68.9% | 54.3% |
What 3 metrics matter the most when scouting a rookie Quarterback? What threshold should Quarterbacks achieve within those metrics to be considered an elite prospect? How much should you value those stats above all other stats? Couldn't answer those questions? Rest easy, we have it handled for you. That's what this chart answers. Sort by importance and/or filter by position. Unlock by signing up with the links provided. $9.99/Year or $24.99 Lifetime access. Cancel anytime.
Through statistical analysis and other tactics seen throughout our “Does It Matter?” series, we’ve unearthed a promising threshold that should be taken into account when scouting Tight Ends for your fantasy football roster. This metric will be a pivotal part in our SPS model due to the strong correlation. Until then, look for Tight Ends who are drafted at or earlier than the 115th overall pick.
Our series has always sought to push the boundaries of sports analytics. This latest installment reaffirms our commitment to uncovering the hidden dynamics that define the game. Every Saturday, we’ll dive into intriguing questions, bust myths, and settle debates with thorough analysis. We welcome your input. Therefore, please leave comments or reach out with topics you’re eager to see dissected. All of our research can be found on our Analytics Page. Up next on our agenda for Part 63 of “Does It Matter?” is an examination of Tight End Top College Yardage Seasons: Does it matter? If so, what’s the Yardage threshold necessary for NFL success? Mark your calendars; every Saturday we shed light on the topics that matter to you. All it takes is a quick question being asked and we will go to work for you!


BrainyBallers Buy-Hold-Sell Chart (All Players)
Get Your Products 100% Refunded By Predicting The Next SuperBowl Winner!
In our extensive 65-part “Does It Matter?” series, we have explored various metrics to gauge their effectiveness in predicting an NFL player’s

When evaluating talent for the NFL, analysts often look at a player’s college performance to predict their professional success. In our 64-part

For our 61 part “Does It Matter?” series, we looked into whether a Wide Receiver’s College Yards After Catch per Reception (YAC/Rec)
