
Can Draft Capital Help Predict Tight End Success?
In our 63-part analytical series, “Does It Matter?”, we next wanted to look into the intriguing question of whether a Tight End’s


When evaluating talent for the NFL, analysts often look at a player’s college performance to predict their professional success. In our 64-part “Does It Matter?” series, we looked into the question of whether a Tight End’s top college yardage season can actually serve as a predictor for their future NFL success. Here are all the patterns and insights we found.
We approached this by studying the top 50 PPR fantasy football finishers each season since 2003, focusing on their top All-Purpose yardage college season. All of our data came from college football reference. In this study, you will see the term “bottom 10”, which refers to those Tight Ends who finished 41st-50th in fantasy scoring each season.
Why the top 50? We selected the top 50 to maintain a “happy medium.” Including more than this would include fringe roster players, who clearly won’t score in the top 10, thus only skewing the data. Conversely, we still wanted to compare the worst to the best. Therefore, we focused on comparing those finishing in the 41st-50th positions, labeling them as the “bottom 10” in our study, to the top 10.
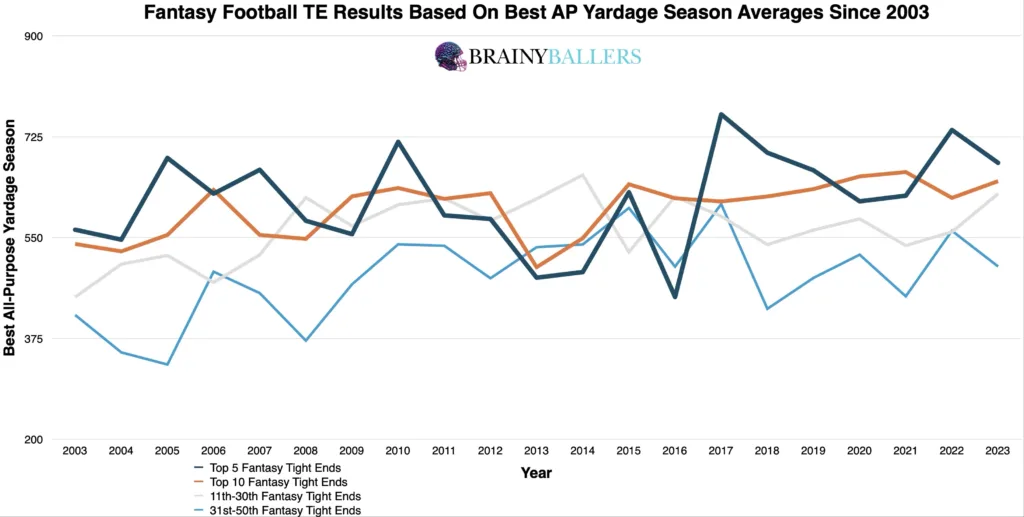
We started by creating an averages chart which shows the averages of the top 5, 10, 11-30th, and 31-50th place Tight Ends annually. The results from this was clear: In 18 out of 21 seasons (85.7%), the top 10 finishers in the NFL outperformed those in the 31st-50th range in terms of top yardage seasons during their college tenure. Simply put; Tight Ends with higher top yardage seasons in college typically performed better in the NFL.
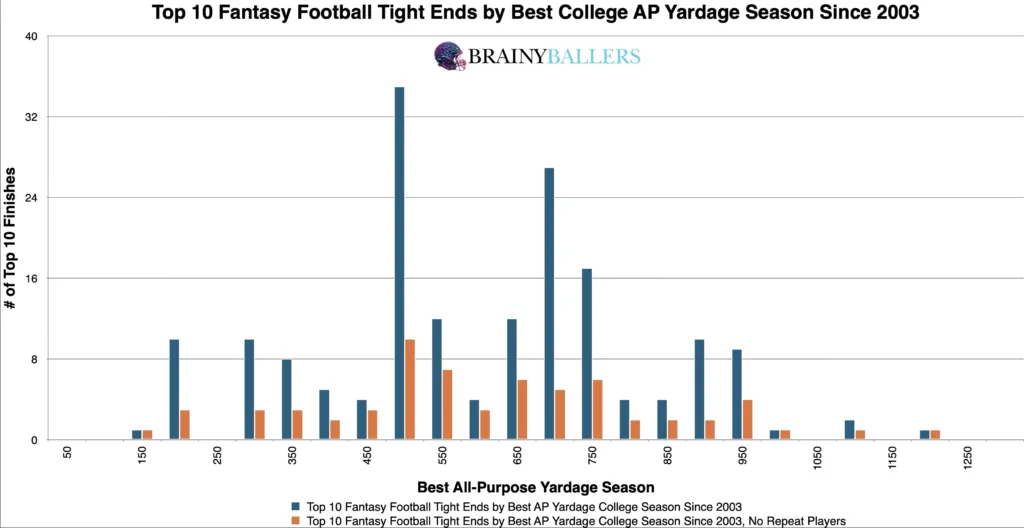
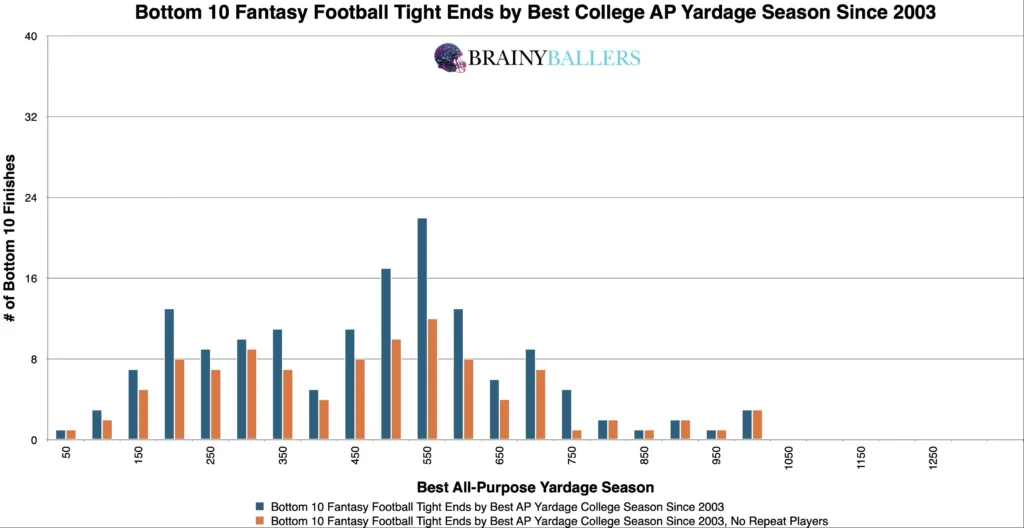
To gain a more granular understanding, we segmented the top and bottom 10 finishers into 50-yard increments based on their top college yardage seasons. This analysis revealed, once again, that those with higher yardages in college had a greater likelihood of achieving higher fantasy football scores during their NFL tenure. That conclusion can be had by comparing the weight and distribution of both of these next charts, where you will see the top 10 coming first:
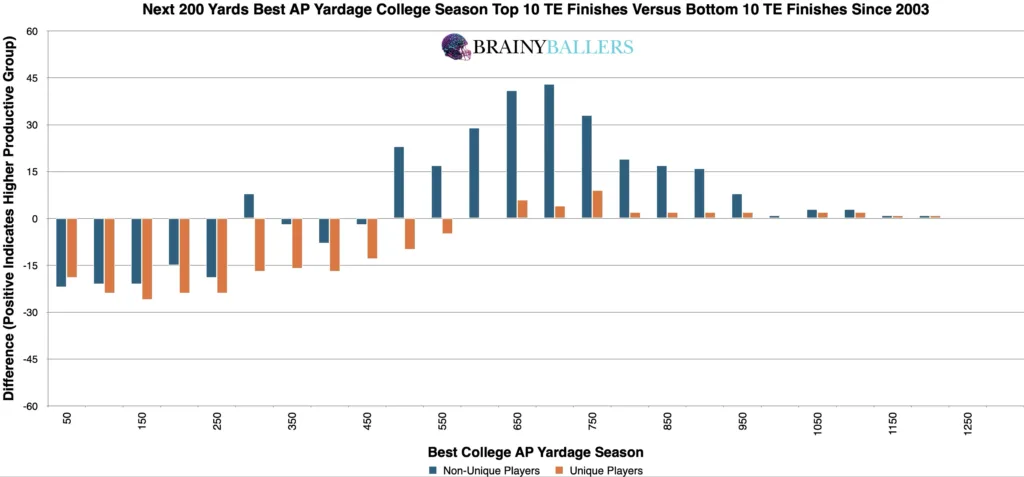
Our main goal was to identify an applicable threshold where performance increases the most and where the least unique players appear, showing top-level consistency. To do this, we developed a differences chart. This chart compares all-purpose yardage in each 50 yard increment, subtracting the results of bottom 10 finishers from the top 10 while also including the next 200 yards. The chart’s desired outcome is a negative number for unique differences (Orange) and a positive number for non-unique differences (Blue). This would indicate the top level consistency we are hoping for. From this analysis, we found that 500 all-purpose yards and above could be the key indicator of an increased top performance likelihood. We will next attempt to verify this range or attempt to find a higher producing one.
We next worked with our spreadsheet to quickly adjust and identify the highest producing range. After testing several numbers near the range indicated by our differences chart, we discovered that setting the threshold at 626 yards and above yields a 30.2% greater top 10 appearance rate compared to the bottom 10. This means that 650 yards is the optimal range which you should hope for in your favorite athletes.
Due to these findings, top college yardage seasons could play a factor in our Star-Predictor Score (SPS) model. Since 132 yards is the lowest top college yardage season seen since 2003 in the top 10, that will be the critical value in the SPS. The Star-Predictor Score (SPS) is a scouting tool designed to maximize investment potential and reduce risks when drafting rookies in Fantasy Football. It is proven to have a higher accuracy than draft capital alone to predict fantasy success. The SPS includes 13 to 17 metrics, with the exact number varying by the player’s position. All these metrics are pre-NFL, and some are invented by us, providing a complete analysis of a player’s analytical profiles. The SPS gained widespread notoriety for its high accuracy, having made it on Barstool and The Pat McAfee Show. The SPS can be found here.
For standard statistical methods, we calculated a Pearson value of 0.218. This indicates a strong correlation between a Tight End’s top college yardage season and future fantasy production. We are hoping for a minimum of 0.1, or an inverse correlation maximum of -0.1 when we study world-class athletes as we are. For reference to something that everyone acknowledges matters in prospect scouting, and to show the accompanying Pearson value, QB draft capital prevailed a -0.219 Pearson value.
We further analyzed data across the last two decades to see whether this is an emerging or dying trend and to assess the significance of our identified optimal range (650+ AP yards) for the top 10, 11-40th place finishers, and the bottom 10. Although our decadal differences chart suggests that this optimal range is declining in prevalence, it remains significant telling by the 23.3% increased top 10 rate of appearance over the bottom 10 in the most recent decade.
| 2004-2013 | |||
| Top 10 | 11 through 40 | Bottom 10 | |
| All count | 84 | 252 | 74 |
| All 8.8 and above | 37 | 81 | 7 |
| % (Optimal Range/all) | 44.0% | 32.1% | 9.5% |
| 2014-2023 | |||
| Top 10 | 11 through 40 | Bottom 10 | |
| All count | 86 | 240 | 70 |
| All 8.8 and above | 47 | 84 | 22 |
| % (Optimal Range/all) | 54.7% | 35.0% | 31.4% |
What 3 metrics matter the most when scouting a rookie Quarterback? What threshold should Quarterbacks achieve within those metrics to be considered an elite prospect? How much should you value those stats above all other stats? Couldn't answer those questions? Rest easy, we have it handled for you. That's what this chart answers. Sort by importance and/or filter by position. Unlock by signing up with the links provided. $9.99/Year or $24.99 Lifetime access. Cancel anytime.
In conclusion, our data shows that a Tight End’s top college yardage season does matter, and in a significant way. You should hope for your favorite athletes to have at least one season of 626 AP Yards and above.
Our series has always sought to push the boundaries of sports analytics. This latest installment reaffirms our commitment to uncovering the hidden dynamics that define the game. Every Saturday, we’ll dive into intriguing questions, bust myths, and settle debates with thorough analysis. We welcome your input. Therefore, please leave comments or reach out with topics you’re eager to see dissected. All of our research can be found on our Analytics Page. Up next on our agenda for Part 65 of “Does It Matter?” is an examination of Tight End 10-Yard Splits: Does it matter? If so, what’s the 10-Yard Split threshold necessary for NFL success? Mark your calendars; every Saturday we shed light on the topics that matter to you. All it takes is a quick question being asked and we will go to work for you!


BrainyBallers Buy-Hold-Sell Chart (All Players)
Get Your Products 100% Refunded By Predicting The Next SuperBowl Winner!
In our 63-part analytical series, “Does It Matter?”, we next wanted to look into the intriguing question of whether a Tight End’s

For our 61 part “Does It Matter?” series, we looked into whether a Wide Receiver’s College Yards After Catch per Reception (YAC/Rec)

In part 60 of our “Does It Matter?” series, we dove into the question of whether a college Wide Receiver’s career Average
