
Tight Ends: Can College Yardage Help Predict NFL Success?
When evaluating talent for the NFL, analysts often look at a player’s college performance to predict their professional success. In our 64-part


In the 57th installment of our “Does It Matter?” series, we dive into college PFF Passer ratings to see whether they can help predict NFL success or not. We aimed to determine if a quarterback’s peak college PFF Passer Rating truly correlates with NFL success, specifically in terms of fantasy football success. Here are all of our findings:
To tackle this question, we looked at the top 30 fantasy football finishers since 2017, since that is the beginning of PFF Passer Ratings. We defined the “bottom 10” as finishers ranked 21st to 30th each season. Also, we excluded rookie years to not allow the typical rookie struggles in the NFL to skew our data. All PFF passer Ratings seen in this article are the top PFF Passer Rating season, not the combined or just the senior season.
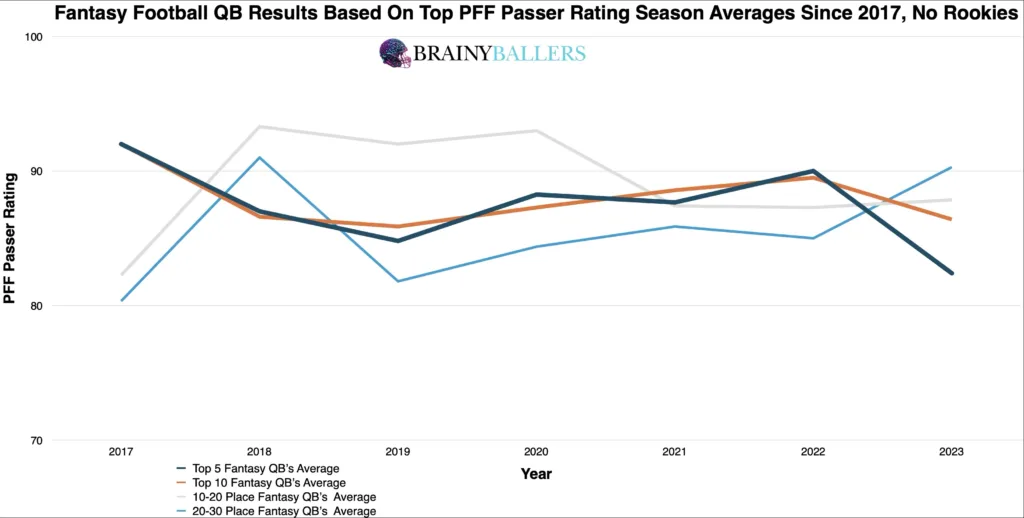
We constructed an averages chart to compare the average top 5, top 10, 11th-20th, and 21st-30th finishes from 2017 onward using their top college PFF Passer Rating scores. This showed that higher top PFF Passer rating seasons more frequently translated to superior NFL fantasy scores than bottom. In 5 out of 7 (71.4%) of the studied seasons, quarterbacks finishing in the top 5 had equal or superior top PFF Passer rating seasons compared to those in the 21st-30th bracket.
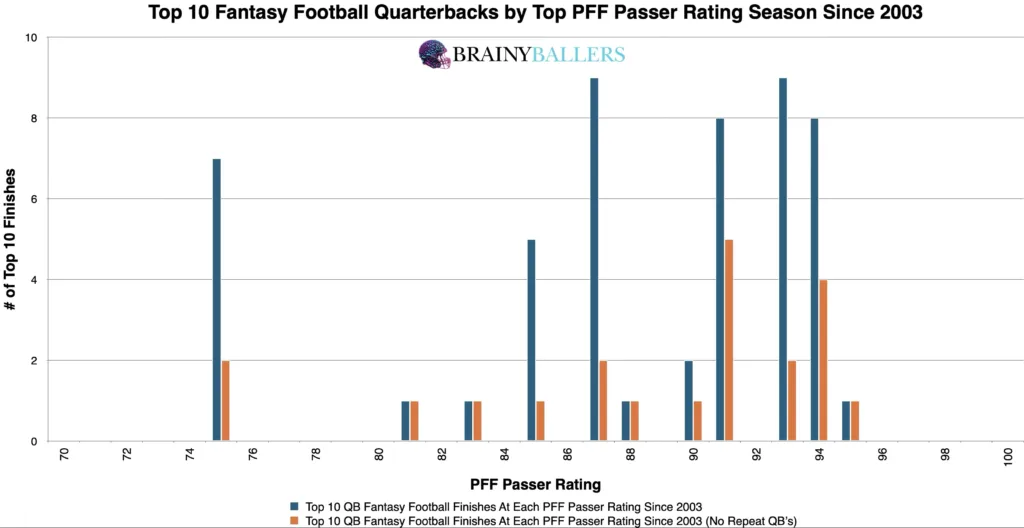
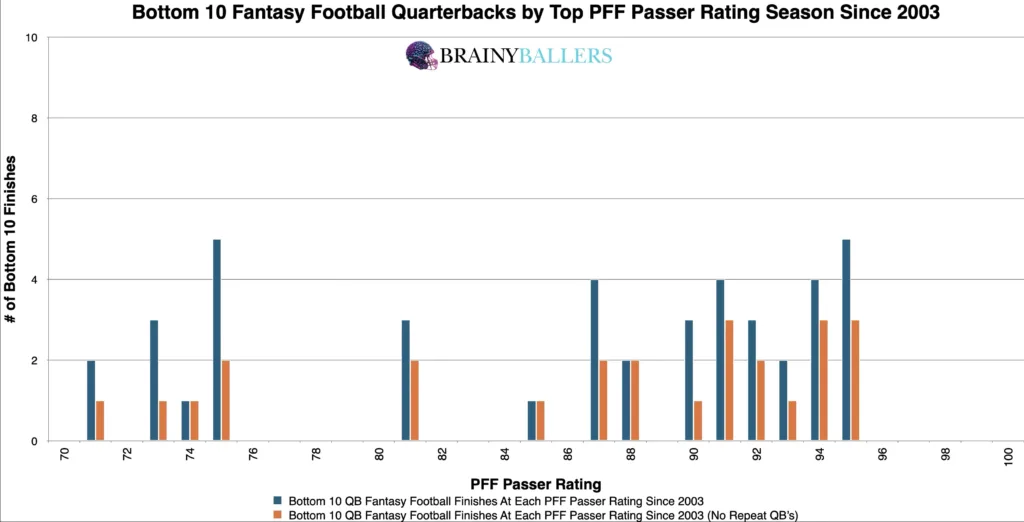
We further dissected top 10 finishers since 2017, segmenting the data into 1.0 passer rating increments. This unveiled the same clear pattern: higher top college PFF passer rating seasons aligned with more successful fantasy outcomes. This is seen by the weight and distribution differences between both of these charts, with the top 10 coming first:
To pinpoint a threshold where increased top level performances occur, we developed a differences chart. This chart compares each PFF Passer Rating season with the next 5.0 PFF Passer Rating, subtracting the bottom 10 from the top 10. The chart’s desired outcome is a negative number for unique differences (Orange) and a positive number for non-unique differences (Blue). This would indicate the top level consistency we are hoping for. From this chart, an 81 PFF Passer Rating and above emerged as a potential top-performing range, guiding us closer to a possible optimal range. We will next attempt to verify this as the top producing range.
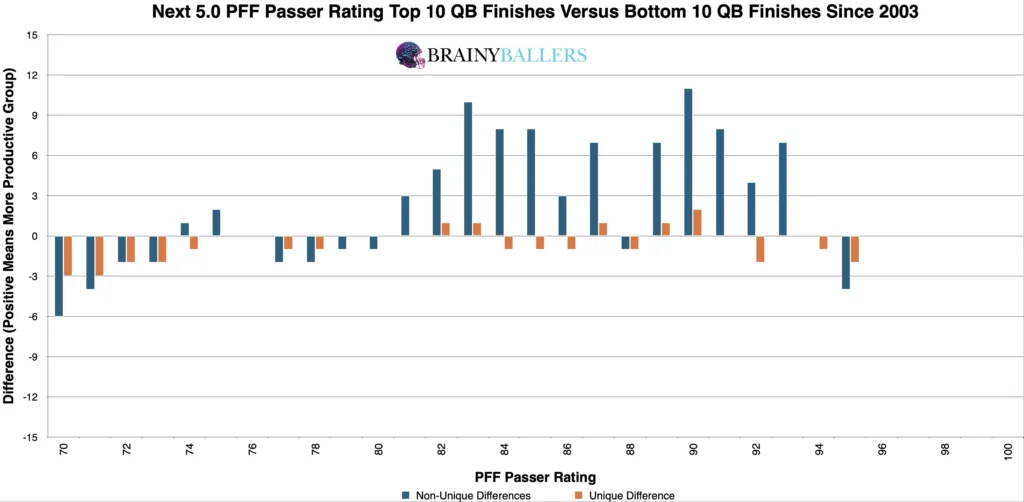
With this initial range in sight, we made adjustments to see if it is the top producing range or not. By testing numbers near the identified range, we discovered that adjusting this threshold to 83 and above produces a 29.6% top 10 appearance rates over the bottom 10. Therefore, the 83+ range becomes the focus of this study and is the optimal range you should hope to see in prospects.
Due to these findings, college PFF Passer Ratings could play a factor in our Star-Predictor Score (SPS) model. Since 75 is the lowest seen since 2003 in the top 10, this will be the critical value for the SPS. The Star-Predictor Score (SPS) is a scouting tool designed to maximize investment potential and reduce risks when drafting rookies in Fantasy Football. It is proven to have a higher accuracy than draft capital alone to predict fantasy success. The SPS includes 13 to 17 metrics, with the exact number varying by the player’s position. All these metrics are pre-NFL, and some are invented by us, providing a complete analysis of a player’s analytical profiles. The SPS gained widespread notoriety for its high accuracy, having made it on Barstool and The Pat McAfee Show. The SPS can be found here.
By employing standard statistical methods we looked to find what the statistical correlation is between peak college PFF passer ratings and NFL performances. Those findings were as seen below:
These results showed a significant – though underwhelming compared to our recent QB findings – correlation between a QB’s peak college PFF Passer Rating season and their NFL fantasy production. We are hoping for a minimum of 0.1, or an inverse correlation maximum of -0.1 when we study world-class athletes as we are. For reference to something that everyone acknowledges matters in prospect scouting, and to show the accompanying Pearson value, QB draft capital prevailed a -0.219 Pearson value.
What 3 metrics matter the most when scouting a rookie Quarterback? What threshold should Quarterbacks achieve within those metrics to be considered an elite prospect? How much should you value those stats above all other stats? Couldn't answer those questions? Rest easy, we have it handled for you. That's what this chart answers. Sort by importance and/or filter by position. Unlock by signing up with the links provided. $9.99/Year or $24.99 Lifetime access. Cancel anytime.
Our findings revealed the value of a peak college PFF Passer Rating season of 83 and above as a helpful indicator of NFL success. This range will be helpful, but not the top metric used in our StarPredictor Score model we are developing. Any Quarterbacks who fall above the treshold of 83 and above should have an increased value above those who do not. Although, this is not saying those who fall under this threshold are certain busts.
Our series has always sought to push the boundaries of sports analytics. This latest installment reaffirms our commitment to uncovering the hidden dynamics that define the game. Every Saturday, we’ll dive into intriguing questions, bust myths, and settle debates with thorough analysis. We welcome your input. Therefore, please leave comments or reach out with topics you’re eager to see dissected. All of our research can be found on our Analytics Page. Up next on our agenda for Part 58 of “Does It Matter?” is an examination of Quarterback Rookie YPG: Does It Matter? If so, what’s the YPG threshold necessary for success? Mark your calendars; every Saturday we shed light on the topics that matter to you. All it takes is a quick question being asked and we will go to work for you!


BrainyBallers Buy-Hold-Sell Chart (All Players)
Get Your Products 100% Refunded By Predicting The Next SuperBowl Winner!
When evaluating talent for the NFL, analysts often look at a player’s college performance to predict their professional success. In our 64-part

In our 63-part analytical series, “Does It Matter?”, we next wanted to look into the intriguing question of whether a Tight End’s

For our 61 part “Does It Matter?” series, we looked into whether a Wide Receiver’s College Yards After Catch per Reception (YAC/Rec)
