
Tight Ends: Can College Yardage Help Predict NFL Success?
When evaluating talent for the NFL, analysts often look at a player’s college performance to predict their professional success. In our 64-part


The “Does It Matter?” series, part 59 looked to uncover the role of a quarterback’s rookie touchdown per game (TD/G) in predicting future success. By analyzing data from the top 30 fantasy football finishers since 2003, we found a rookie passing td per game threshold you should look for. Further, you will see us applying an optimal range we found against the 2023 and 2024 Rookie QB’s to give us some recent insights. Here are all of our findings:
To structure our study, we focused on the top 30 fantasy football finishers each season since 2003. To prevent rookie-year struggles from skewing our results, we excluded rookie seasons from the Fantasy leaderboards. However, we still accounted for their rookie TD/G for future fantasy leaderboard data entries. Also, the term “bottom 10” refers to those finishing 21st to 30th in each season season.
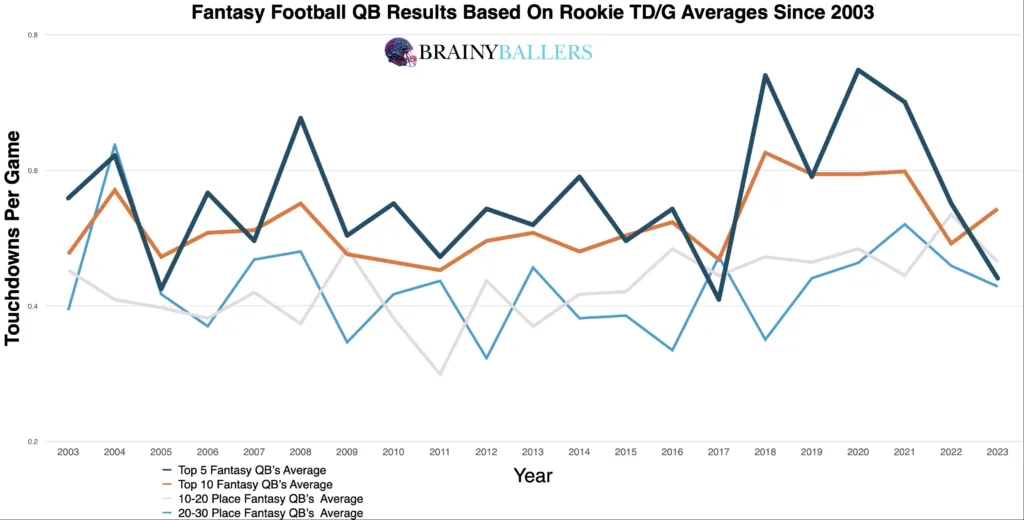
We began by constructing an averages chart which shows the average top 5, top 10, 11th-20th, and 21st-30th place finishers since 2003. The results from this were clear: quarterbacks with greater rookie TD/G seasons typically achieved higher future fantasy scores. Specifically, in 19 out of 21 seasons (90.5%), the top 5 finishers boasted the same or a higher rookie TD/G compared to those in the bottom 10. This consistent pattern began showing the importance of rookie TD/G as an indicator of future performance.
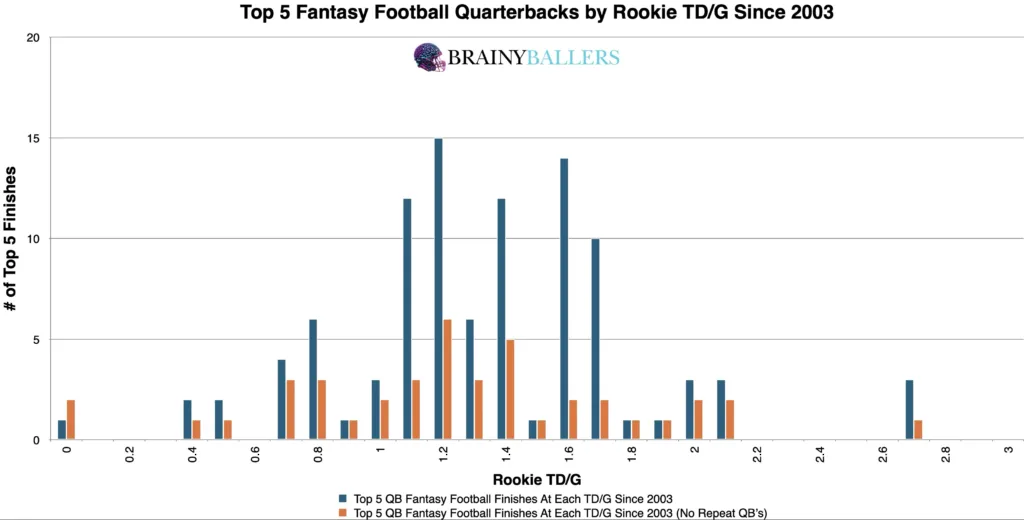
Next, we broke down the top 5 finishers since 2003 into segments of 0.1 TD/G. This further emphasized the correlation between higher rookie TD/G seasons and future fantasy success. The weight and distribution of both charts confirmed this trend, reinforcing the idea that rookie performance in this metric holds predictive value.
Our main objective was to uncover an applicable threshold where the most significant performance boost occurs for quarterbacks and identify the range where the least unique players show up, indicating top-level consistency. To achieve this, we created a differences chart that compares each rookie TD/G season plus the next 0.3 TD/G by subtracting the bottom 10 results from the top 10. The chart’s desired outcome is a negative number for unique differences (Orange) and a positive number for non-unique differences (Blue). This would indicate the top level consistency we are hoping for. This revealed that a rookie TD/G of 1.0 and above appears to be the top-performing range. This insight moves us closer to pinpointing a possible predictive range for future quarterback success. Next we will attempt to confirm that this range accurately identifies the highest-producing range.
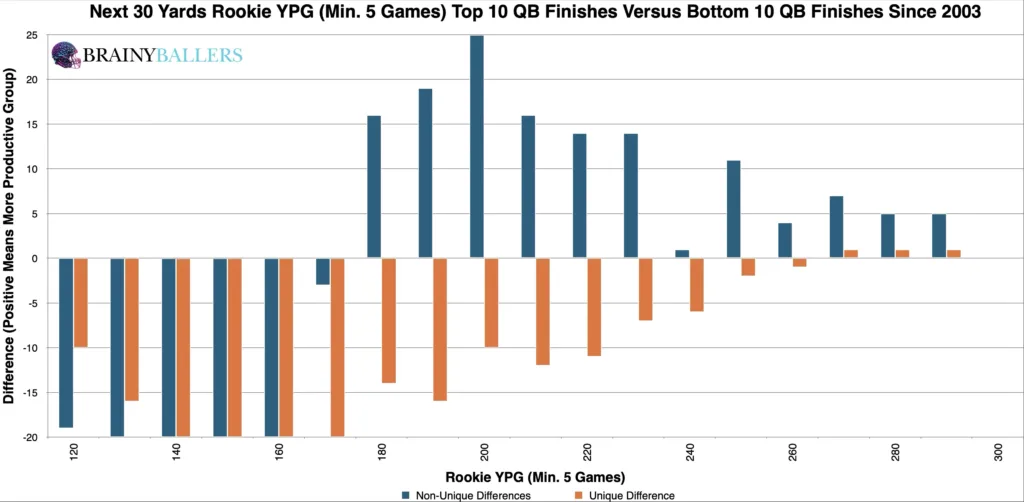
After experimenting with various numbers close to the range highlighted by our differences chart, we determined that a rookie TD/G of 1.0 and above leads to a 29.1% higher appearance rate in the top 10 than in the bottom 10. This range will therefore be the optimal range for rookie passing td per game and is what you should look for in rookie QB’s.
Due to these findings, rookie TD/G could play a factor in our Post-Rookie Star-Predictor Score (SPS) model. The Star-Predictor Score (SPS) is a scouting tool designed to maximize investment potential and reduce risks when drafting rookies in Fantasy Football. It is proven to have a higher accuracy than draft capital alone to predict fantasy success. The SPS includes 13 to 17 metrics, with the exact number varying by the player’s position. All these metrics are pre-NFL, and some are invented by us, providing a complete analysis of a player’s analytical profiles. The SPS gained widespread notoriety for its high accuracy, having made it on Barstool and The Pat McAfee Show. The SPS can be found here.
Our statistical analysis yielded extremely similar results to our last Quarterback article looking into rookie passing yards per game. The TD/G results for this article are as follows:
This shows a strong correlation between a quarterback’s rookie TD/G and future fantasy performances. We are hoping for a minimum of 0.1, or an inverse correlation maximum of -0.1 when we study world-class athletes as we are. For reference to something that everyone acknowledges matters in prospect scouting, and to show the accompanying Pearson value, QB draft capital prevailed a -0.219 Pearson value. This means Rookie TD/G to future success means slightly less than draft capital to Running Backs, just in opposite ways.
Next, we explored how our QB rookie TD/G optimal range appeared across the last two decades. Specifically, we examined its significance for the top 10, 11th-20th place finishers, and the bottom 10. Our decadal differences chart suggests that this optimal range, though in decline, still holds significance in predicting high-level quarterback performances.
| 2004-2013 | |||
| Top 5 | 6 through 24 | Bottom 5 | |
| All count | 49 | 194 | 49 |
| All 1 and above | 44 | 106 | 26 |
| % (Optimal Range/all) | 89.8% | 54.6% | 53.1% |
| 2014-2023 | |||
| Top 5 | 6 through 24 | Bottom 5 | |
| All count | 50 | 200 | 46 |
| All 1 and above | 41 | 142 | 27 |
| % (Optimal Range/all) | 82.0% | 71.0% | 58.7% |
In conclusion, rookie passing td per game (TD/G) is a promising predictor of long-term quarterback success in fantasy football. 1.0 and above passing td per game is what you should look for in rookie QB’s who start at least 5 games for the first time in their careers. You should be concerned with any QB who does not meet this threshold and begin monitoring their situation and production closely, but this does not mean to sell them ASAP.
What 3 metrics matter the most when scouting a rookie Quarterback? What threshold should Quarterbacks achieve within those metrics to be considered an elite prospect? How much should you value those stats above all other stats? Couldn't answer those questions? Rest easy, we have it handled for you. That's what this chart answers. Sort by importance and/or filter by position. Unlock by signing up with the links provided. $9.99/Year or $24.99 Lifetime access. Cancel anytime.
Our series has always sought to push the boundaries of sports analytics. This latest installment reaffirms our commitment to uncovering the hidden dynamics that define the game. Every Saturday, we’ll dive into intriguing questions, bust myths, and settle debates with thorough analysis. We welcome your input. Therefore, please leave comments or reach out with topics you’re eager to see dissected. All of our research can be found on our Analytics Page. Up next on our agenda for Part 60 of “Does It Matter?” is an examination of Wide Receiver College Career ADOT: Does It Matter? If so, what’s the ADOT threshold necessary for success? Mark your calendars; every Saturday we shed light on the topics that matter to you. All it takes is a quick question being asked and we will go to work for you!


BrainyBallers Buy-Hold-Sell Chart (All Players)
Get Your Products 100% Refunded By Predicting The Next SuperBowl Winner!
When evaluating talent for the NFL, analysts often look at a player’s college performance to predict their professional success. In our 64-part

In our 63-part analytical series, “Does It Matter?”, we next wanted to look into the intriguing question of whether a Tight End’s

For our 61 part “Does It Matter?” series, we looked into whether a Wide Receiver’s College Yards After Catch per Reception (YAC/Rec)
