Can A Tight End’s 10-Yard Split Help Predict Their NFL Success?
In our extensive 65-part “Does It Matter?” series, we have explored various metrics to gauge their effectiveness in predicting an NFL player’s
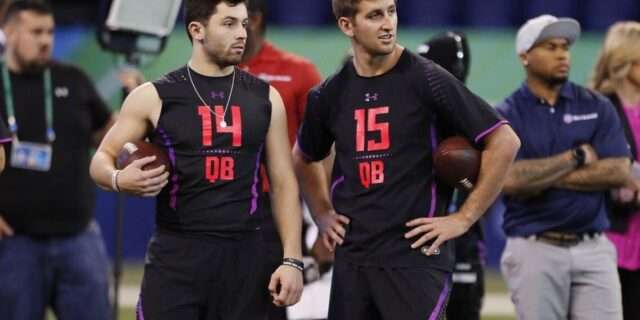
In following up on our comprehensive examination of NFL quarterbacks’ weight and if that effects performance, we’ve now turned our focus towards another QB topic: Does a quarterback’s height influence their success on the field? Building on the groundwork laid out in the first part of our QB series, this segment also focuses on the top 30 fantasy football quarterbacks from 2003 to 2023. We are here to dive into their physical attributes to unearth any and all correlations.
Our approach involved using centimeters to represent the quarterbacks’ height for extreme accuracy. Then we converted and rounded those figures to the nearest 1/8 of an inch for our data charts seen within this article. This study omits rookies to remove the initial learning curve season quarterbacks often go through. Further, we only analyzed players using their combine heights. This ensured consistency throughout our numbers and allowed for the ability to spot trends for fantasy football enthusiasts who follow rookies throughout the combine process.
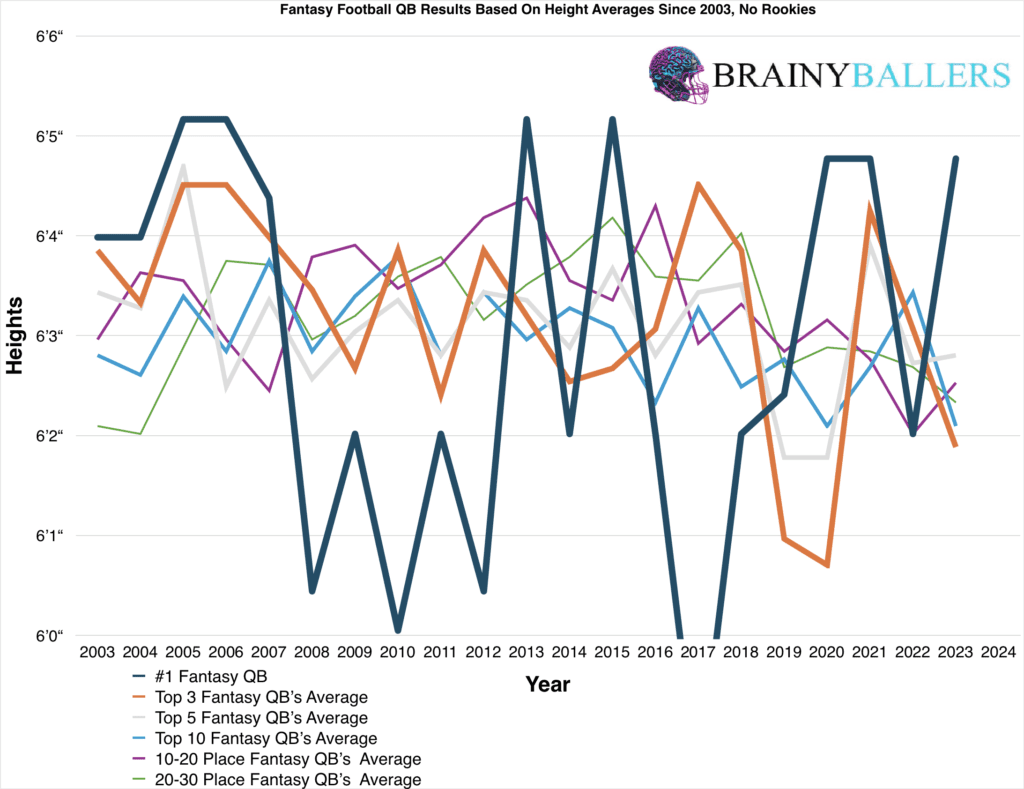
Above is our first chart which is similar to the Weight averages found in that article. We looked at fantasy football leaderboards for each season since 2003 and found the averages for the top 1, top 3, top 5, top 10, 11-20th, and lastly the 21-30th place finishers. Very similar to the weight averages, it was very difficult to pull any trends from this. Or at least any that led to substantial enough findings. Our goal at this point was to dive beyond these averages to look for trends.
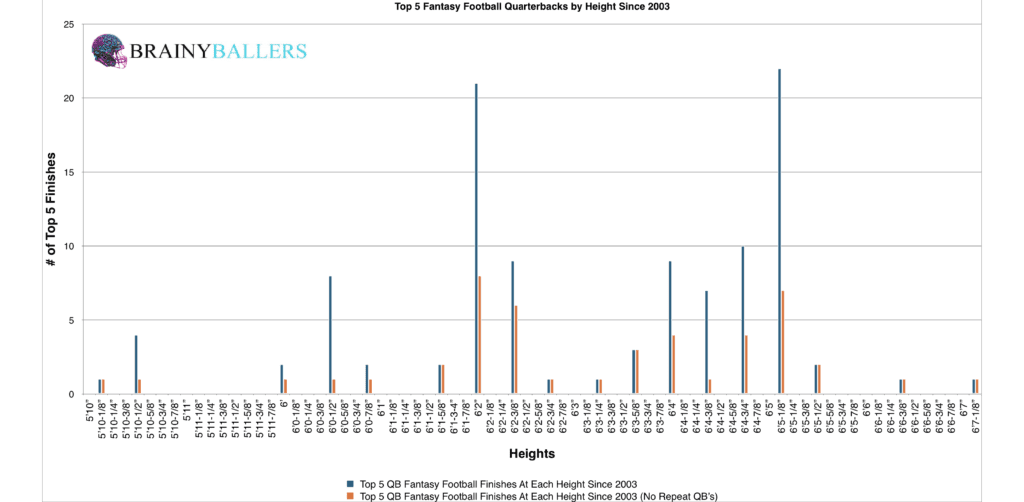
Pictured above is each Top 5 finish from NFL Quarterbacks since 2003 segmented out across each height. Anyone looking at this could assume the trend will be anywhere from 6’2” and 6’5-1/8”. Although, pictured below is the Bottom 5 finishers for the same time period:
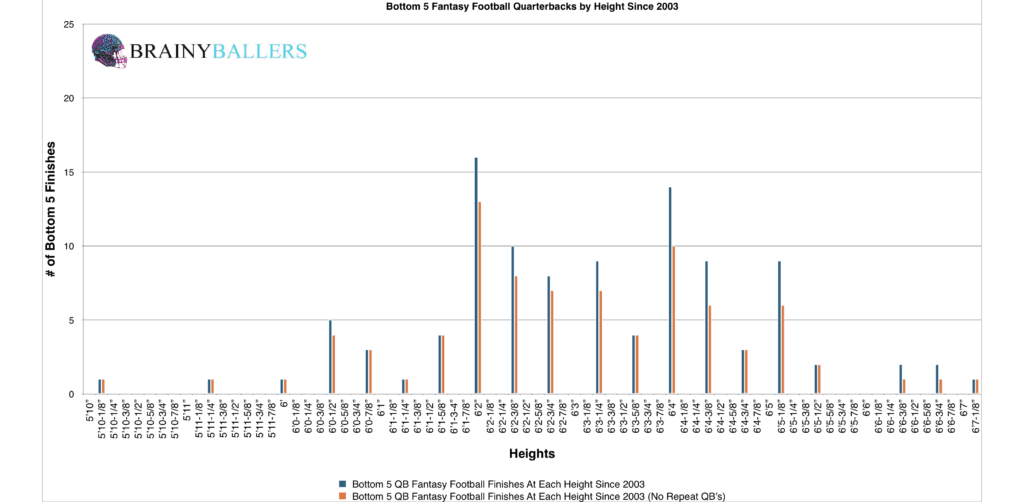
By comparing the bottom 5 to the top 5 quarterbacks, you can see the range is similar with a small boost at 6’2”. Although, on the upper side of that range there appears to be a much larger difference benefiting the top 5 at the 6’5-1/8” height.
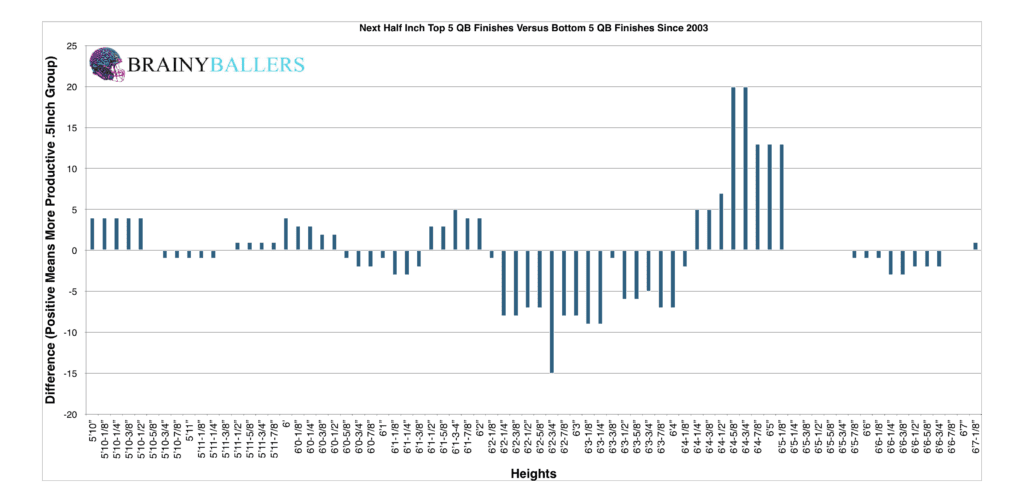
From this, we were curious where the highest concentration of improvement at every .5 inch interval was from the bottom 5 to the top 5. Through excel formulas, we were able to find a larger than .5 inch concentration of heights from the top 5 in comparison to the bottom 5 within a .625 inch range. This can be visualized in the picture below where each bar shows a difference between the top 5 and bottom 5 within the next .5 inches starting at the bars allocated height. At exactly 6’4-5/8” the graph shows its largest value, indicating the next .5inches will reach its peak. The bar to the right of that (6’4-3/4”) shows sustainment, indicating an added .125 inches to that .5 inch group. Which is therefore further verifying the .625” bracket.
We wanted to compare this height range from every top 5 finisher to every finisher in 6-30th place since 2003. Amongst every quarterback who finished between 6-30th place since 2003, this height range accounted for 20% of all quarterbacks. This established a baseline for comparing to our top 5 findings.
When focusing on just the top 5 performers, the statistics were compelling. A total of 32 out of 105 quarterbacks (30.4%) within the top 5 resulted in this specific height bracket. To further verify this trend, we calculated the bottom 5. The bottom 5 had a mere 11.4% (12 out of 105). This showcases a near 20% difference of being within this height bracket from the bottom 5 and top 5!
Diving into the data by each decade revealed insightful trends. For each decade from 2004-2013 and 2014-2023, we wanted to see how many quarterbacks ended in the top 5, 6-25th place, and the bottom 5 finishers in the league within this height range we found. The results are as follows:
A small trend can be seen from this: a gradual evening out in terms of height representation across performance tiers and across decades. Although, there is still a notable 11% higher percentage of top 5 performance for quarterbacks within this 6’4-5/8” and 6’5-1/4” height range in the most recent decade compared to the bottom 5. Perhaps this most recent trend can be attributed to more NFL knowledge of this height range being the target.
We next explored the correlation between weights and NFL performances using standard statistical methods. Here are our findings:
These results showed no correlation between a QB’s height and their NFL fantasy production. Given our focus on world-class athletes, a Pearson value over 0.1 or under -0.1 is significant for indicating predictive power. For reference to something that everyone acknowledges matters in prospect scouting, and to show the accompanying Pearson value, RB draft capital prevailed a -0.234 Pearson value.
Joe Milton stands out as the lone player fitting within the desirable height range, giving us more vindication for having him as a fantasy football buy this year. Drake Maye emerges as a close second. In contrast, Caleb Williams finds himself at a notable disadvantage. At 6’1-.125”, he falls short of the ideal height criteria.
Height could play a small factor in our Star-Predictor Score (SPS) model. The Star-Predictor Score (SPS) is a scouting tool designed to maximize investment potential and reduce risks when drafting rookies in Fantasy Football. It is proven to have a higher accuracy than draft capital alone to predict fantasy success. The SPS includes 13 to 17 metrics, with the exact number varying by the player’s position. All these metrics are pre-NFL, and some are invented by us, providing a complete analysis of a player’s analytical profiles. The SPS gained widespread notoriety for its high accuracy, having made it on Barstool and The Pat McAfee Show. The SPS can be found here.

What 3 metrics matter the most when scouting a rookie Quarterback? What threshold should Quarterbacks achieve within those metrics to be considered an elite prospect? How much should you value those stats above all other stats? Couldn't answer those questions? Rest easy, we have it handled for you. That's what this chart answers. Sort by importance and/or filter by position. Unlock by signing up with the links provided. $9.99/Year or $24.99 Lifetime access. Cancel anytime.
Our series has always sought to push the boundaries of sports analytics, and this latest installment reaffirms our commitment to uncovering the hidden dynamics that define the game. Every Saturday We will dive deep into the most intriguing questions, bust myths, and settle debates with thorough analysis similar to this. We thrive on curiosity and welcome your input — so please, leave comments or reach out to us with topics you’re eager to see dissected next. All of our research can be found on our Analytics Page. Up next on our agenda for Part 3 of “Does It Matter?” is our next examination of NFL Quarterbacks: Does Hand Size matter? If so, what’s the Hand Size necessary for success? Mark your calendars; every Saturday we shed light on the topics that matter to you. All it takes is a quick question being asked and we will go to work for you!


Related Content:

In our extensive 65-part “Does It Matter?” series, we have explored various metrics to gauge their effectiveness in predicting an NFL player’s
When evaluating talent for the NFL, analysts often look at a player’s college performance to predict their professional success. In our 64-part
In our 63-part analytical series, “Does It Matter?”, we next wanted to look into the intriguing question of whether a Tight End’s
© 2023 BrainyBallers | All Rights Reserved