Can A Tight End’s 10-Yard Split Help Predict Their NFL Success?
In our extensive 65-part “Does It Matter?” series, we have explored various metrics to gauge their effectiveness in predicting an NFL player’s


For part 21 of our “Does It Matter?” series, we looked into the often debated topic of height and its impact on the success of NFL Tight Ends. By running through our datasets, we attempted to discover whether height could be a reliable predictor of success in fantasy football rankings. Here’s a detailed breakdown of our methodology and findings.
To maintain accuracy and consistency, we strictly used NFL Combine numbers. Further, we analyzed the top 50 fantasy football PPR finishers since 2003. The “bottom 10” was defined by those ranked 41st to 50th each season.
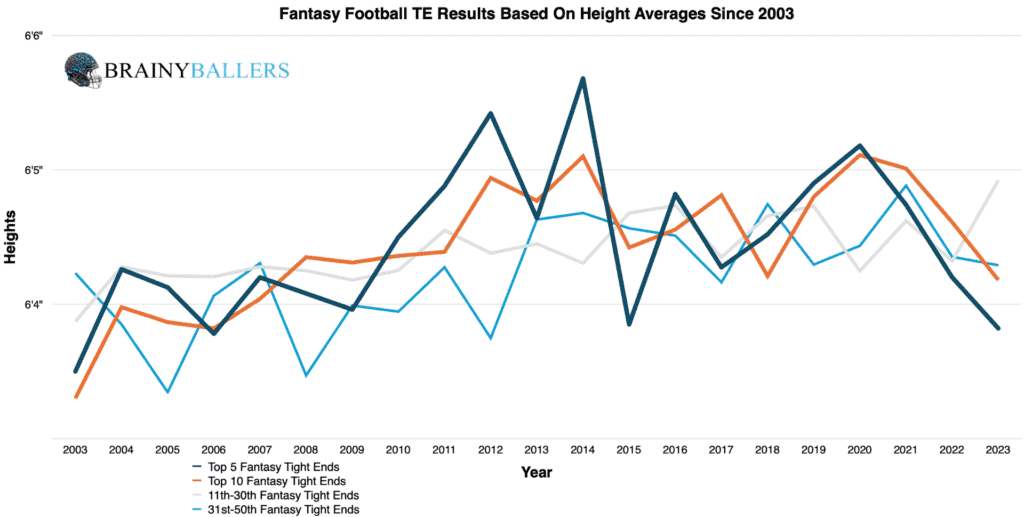
To begin our detailed analysis, we created an averages chart which categorizes NFL Tight Ends into four different groups: top 5, top 10, 11th-30th, and 31st-50th place since 2003. This allowed us to identify trends, if any, and to better understand height’s potential correlation with performance. Although, from this, the height averages chart did not reveal any clear and eye-opening conclusions.
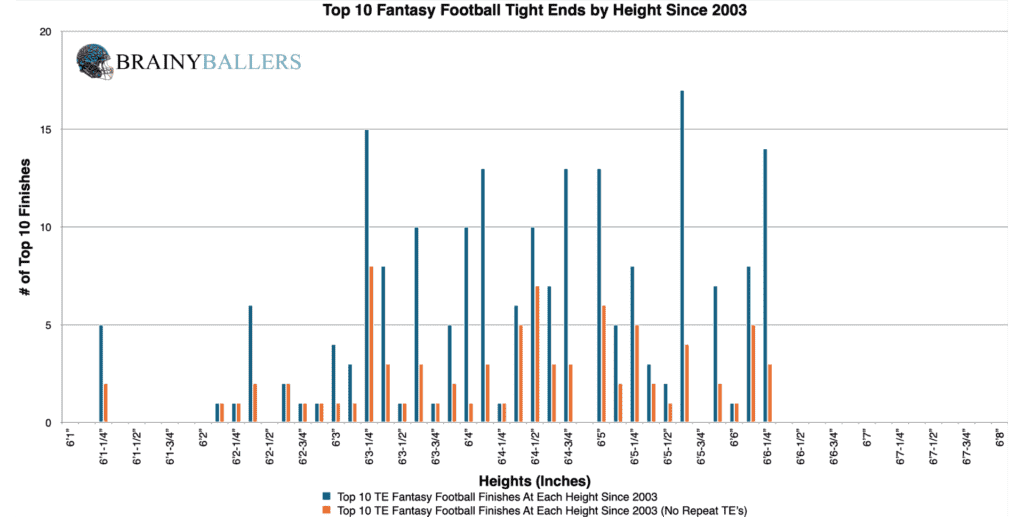
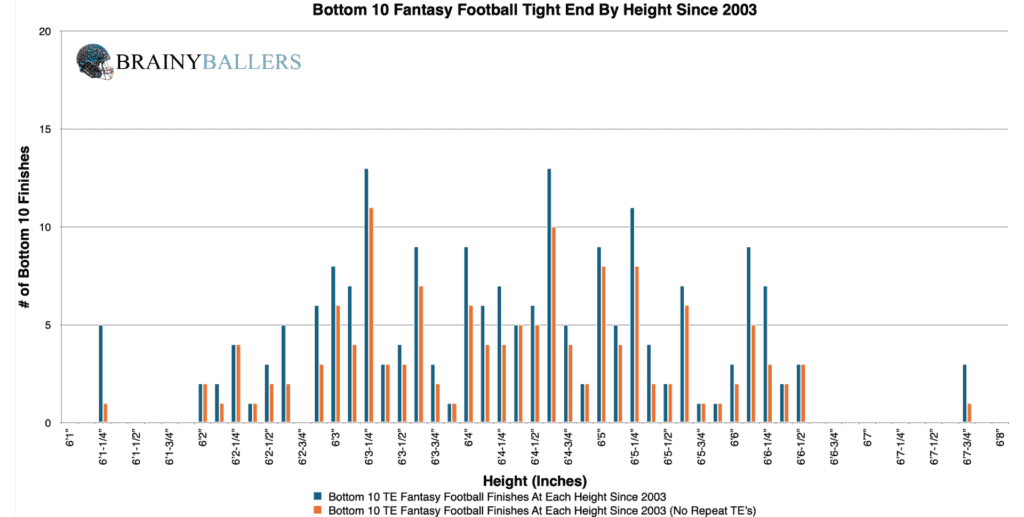
To dig deeper, we segmented the heights of top 10 finishers into 1/8” height increments. This detailed segmentation revealed a more telling pattern: it appeared that higher finishers were more commonly found within higher height ranges. You can see this by comparing the next two charts, which is the segmented top 10 and bottom 10 charts, in that order.
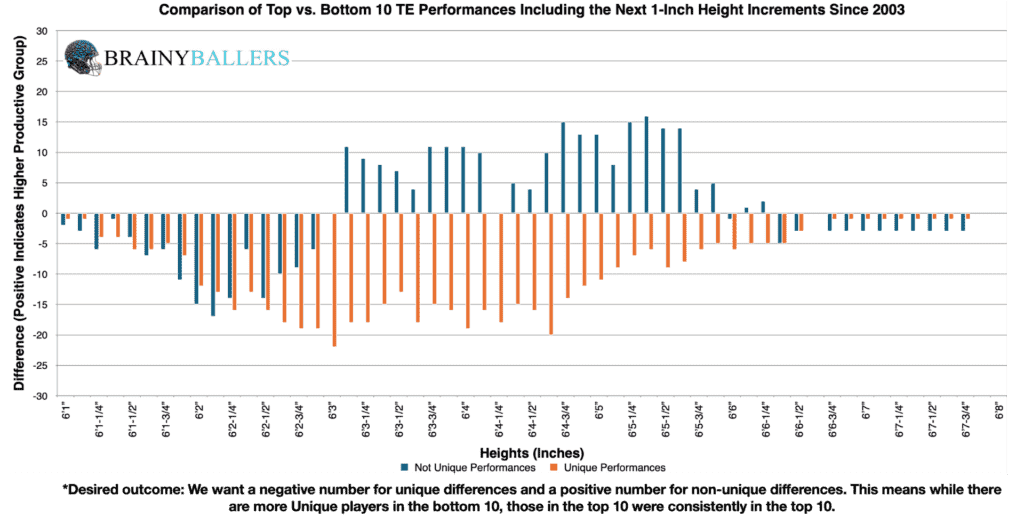
In an attempt to identify the optimal height range for top-performing Tight Ends, we created a differences chart. This compares each height and the next 1 inch, subtracting the bottom 10 results from the top 10. The chart’s desired outcome is a negative number for unique differences (Orange) and a positive number for non-unique differences (Blue). This would indicate the desired consistent top level performances we are hoping for. This got us closer to our optimal range, which from the chart appears to be 6’3-1/8″ to 6’6-7/8″. Next, we will attempt to verify whether this truly is the top performing range or not.
Next, we looked at data from all TEs who finished in the bottom 10 since 2003. Among 204 Tight Ends, 157 fell within our identified range of 6’3-1/8″ to 6’6-7/8″, accounting for 77%. This provided a baseline for comparison to the top 10.
If more than 77% of the top 10 fell within this height range, then we found a top producing Tight End height, not just an average Tight End height. 181 of 202 top finishers fell within our identified range, accounting for 89.6%. This accounted for a 12.6% increase over our baseline. Therefore, we found a top producing height. Although, we wanted to verify this, so we tested several heights close to our identified height range, which you will see next.
As mentioned, we wanted to verify whether this is in fact the top producing range or not. To determine this, we played with the bottom and top end of this range. This was to see what produces the largest top 10 to bottom 10 percentage increase. By adjusting the top and bottom side of this range, we realized that the range of 6’3-1/4″ to 6’6-1/4″ appears 17.0% more often in the top 10 than in the bottom 10. This range will be the subject of this research going forward.
Due to these findings, height could play a factor in our Star-Predictor Score (SPS) model. Since 6’1.25″ is the lowest seen since 2003 in the top 10, this will be the critical value for the SPS in regards. The Star-Predictor Score (SPS) is a scouting tool designed to maximize investment potential and reduce risks when drafting rookies in Fantasy Football. It is proven to have a higher accuracy than draft capital alone to predict fantasy success. The SPS includes 13 to 17 metrics, with the exact number varying by the player’s position. All these metrics are pre-NFL, and some are invented by us, providing a complete analysis of a player’s analytical profiles. The SPS gained widespread notoriety for its high accuracy, having made it on Barstool and The Pat McAfee Show. The SPS can be found here.
Next, we wanted to use standard statistical methods to see whether they would provide us correlation support. Although, these standard methods revealed no significant correlation between height and TE fantasy production. These findings can be seen below:
This relationship highlights a weak correlation between height and future fantasy production. We are hoping for a minimum of 0.1, or an inverse correlation maximum of -0.1 when we study world-class athletes as we are. For reference to something that everyone acknowledges matters in prospect scouting, and to show the accompanying Pearson value, RB draft capital prevailed a -0.234 Pearson value.
To identify prevailing or emerging trends, we examined the heights of players across the last two decades. We focused on three groups: the top 10 finishers, those ranked 11-40, and the bottom 10 finishers. The trend we observed was a noticeable 22.9% decrease in the rate at which players within our identified optimal height range appeared in the top 10 finishers in the most recent decades compared to the earlier decade.
| 2004-2013 | |||
| Top 10 | 11 through 40 | Bottom 10 | |
| All count | 98 | 287 | 99 |
| All Between 6’3-1/4 and 6’6-1/4” | 88 | 199 | 59 |
| % (hard zone/all) | 89.8% | 69.3% | 59.6% |
| 2014-2023 | |||
| Top 10 | 11 through 40 | Bottom 10 | |
| All count | 96 | 286 | 96 |
| All Between 6’3-1/4 and 6’6-1/4” | 86 | 234 | 79 |
| % (hard zone/all) | 89.6% | 81.8% | 82.3% |
What 3 metrics matter the most when scouting a rookie Quarterback? What threshold should Quarterbacks achieve within those metrics to be considered an elite prospect? How much should you value those stats above all other stats? Couldn't answer those questions? Rest easy, we have it handled for you. That's what this chart answers. Sort by importance and/or filter by position. Unlock by signing up with the links provided. $9.99/Year or $24.99 Lifetime access. Cancel anytime.
These findings highlighted the impactful role of height in NFL Tight End performances. Our research indicated that the height range between 6’3-1/4″ and 6’6-1/4″ is the sweet spot for Tight Ends, where more elite performances occur. Unfortunately, our regression testing was a near miss for supporting a strong correlation between height and fantasy output.
Our series has always sought to push the boundaries of sports analytics. This latest installment reaffirms our commitment to uncovering the hidden dynamics that define the game. Every Saturday, we’ll dive into intriguing questions, bust myths, and settle debates with thorough analysis. We welcome your input. Therefore, please leave comments or reach out with topics you’re eager to see dissected. All of our research can be found on our Analytics Page. Up next on our agenda for Part 22 of “Does It Matter?” is an examination of TE Weight: Does it matter? If so, what’s the weight threshold necessary for success? Mark your calendars; every Saturday we shed light on the topics that matter to you. All it takes is a quick question being asked and we will go to work for you!


In our extensive 65-part “Does It Matter?” series, we have explored various metrics to gauge their effectiveness in predicting an NFL player’s

When evaluating talent for the NFL, analysts often look at a player’s college performance to predict their professional success. In our 64-part

In our 63-part analytical series, “Does It Matter?”, we next wanted to look into the intriguing question of whether a Tight End’s
