Can A Tight End’s 10-Yard Split Help Predict Their NFL Success?
In our extensive 65-part “Does It Matter?” series, we have explored various metrics to gauge their effectiveness in predicting an NFL player’s


For the 54th part of our “Does It Matter?” series, we looked to find out whether the Star-Predictor Score (SPS), found here, is a reliable indicator of a quarterback’s future success. Our goal was to uncover the significance of the SPS and establish the ideal benchmark for making informed decisions between prospects or evaluating a single player’s potential. Currently, the top 10 all-time is looking like the best of all our positions in the SPS. With 51 pro bowl appearances and 7 Superbowl wins, this is the most exciting position we’ve posted. This article will guide you on how the SPS can help identify undervalued players and verify or challenge the public consensus of star potential in the top NFL Draft picks. To give a sneak peak at the 2025 QB class – the SPS is seeing something that most people are not. Here are all of our findings:
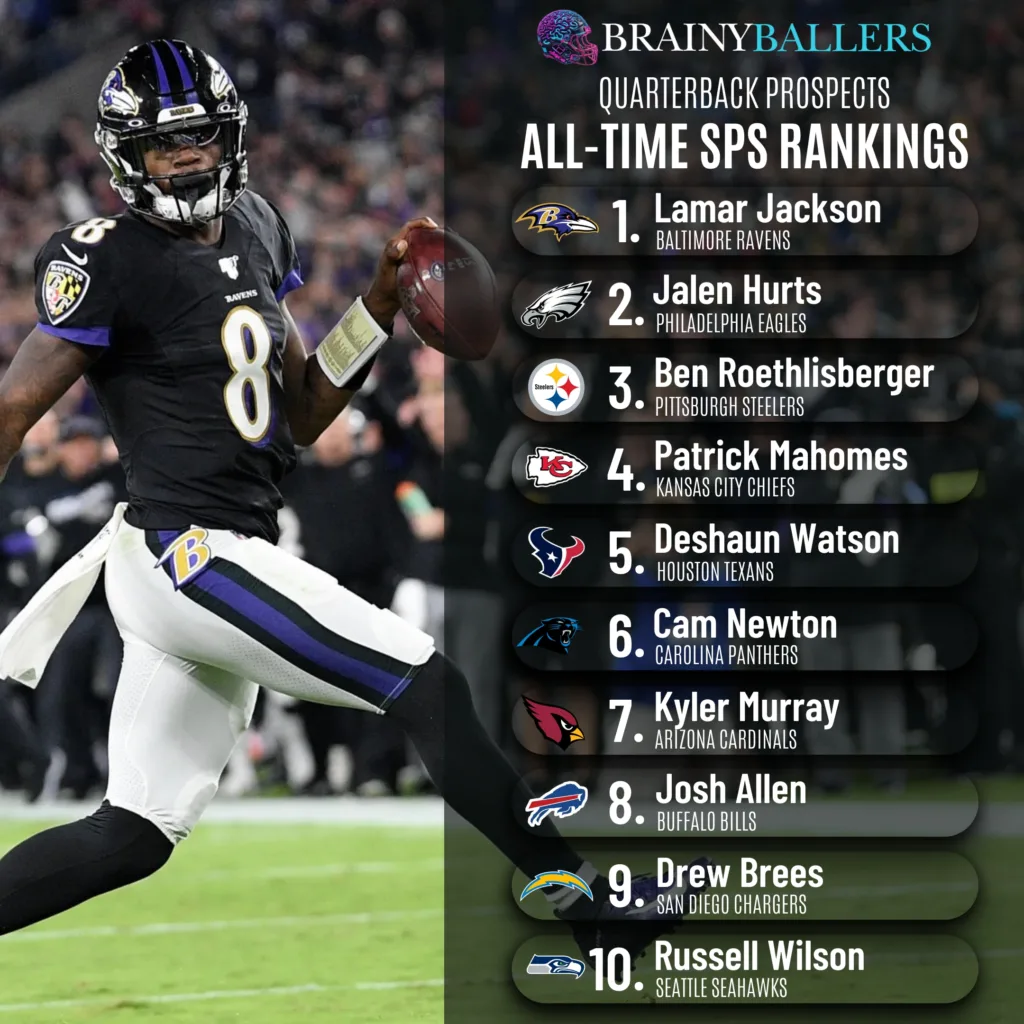
The Star-Predictor Score (SPS) was built as a prospect scouting tool aimed at maximizing investment potential while minimizing risks when drafting rookies in Fantasy Football. Developed using data since 2003, the SPS formula was then applied to every drafted or undrafted free agent (UDFA) since then. From that, and out of a total of 309 Quarterbacks, the following top 10 prevailed:
The analysis you’re about to see regarding how powerful the SPS is first focuses on the top 30 fantasy football finishers since 2003, calculated using PPR fantasy scores. Then, by comparing coefficients, we evaluated whether SPS or Draft capital offered better predictions for career fantasy points. Terms like “bottom 5”, which you will see throughout this analysis, refers to fantasy finishers ranked 26th to 30th each season. Just as we have always done with all of our QB analysis, this excludes rookie seasons to not allow for rookie struggles to skew our data. The Star-Predictor Score (SPS) for Quarterbacks utilizes 15 distinct metrics from various sources to come together into one predictive model. It is presented in a percentile grading system, therefore the top player ever will have a 100.0 SPS grade.
Why the top 30? We did this to accurately compare the QB SPS to all other metrics we’ve researched. Selecting the top 30 provides a “happy medium” approach. Expanding beyond this point would include fringe roster players, unlikely to rank in the top 5, and could therefore only skew the data. On the other hand, by choosing this range, we create a comparison between the “best” and the “worst”. This is why we chose the 26th to 30th place finishers to contrast against the top 5.
Before we get into the analysis, it’s important to note that the SPS excels with predicting the career trajectory of QB’s picked between the 1st and 60th overall pick. Therefore, our table will mainly only show those players. A higher SPS means higher fantasy success potential.
As far as the 2024 Quarterback class, the SPS had Jayden Daniels at 79.1 SPS, and Caleb Williams at 74.9. Going back to 2018, the SPS had Josh Allen at 93.6 SPS and Lamar Jackson at 100 SPS. In that same class, the SPS had Baker Mayfield at 71.9, Sam Darnold at 76, and Josh Rosen at 65 SPS, practically perfectly executing one of the most successful QB classes in the last decade, which became successful in ways only the SPS seen – the SPS had it in reverse order of public consensus, but in near perfect order of career success. This is looking eerily similar to what the 2025 QB Draft class is looking like currently.
To see the all-time table, you can click here. From those hits alone it’s not hard to see how the SPS has missed less than draft capital, which we will go into further detail within this article.
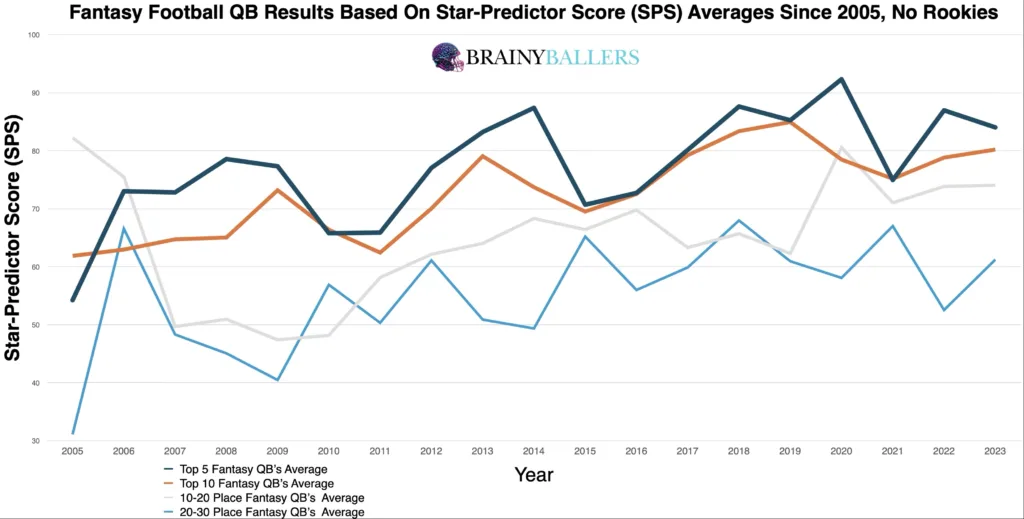
To begin our research, we first wanted to visualize trends by using the averages of the top 5, 10, 11-20th, and 21-30th place finishers’ averages since 2005. From this, a clear and obvious trend was seen: higher average SPS Grades have always yielded higher fantasy scores. In 100% of the last 19 seasons, the top 10 finishers boasted higher SPS scores than those ranked 31st to 50th, with an average difference of 22.2 SPS between the top 5 and 21st-30th place finishers each season. This chart is typically great at indicating correlating metrics, like in the example with defensive end weights where no trend was visible in the averages chart, and weights ended up having zero correlation and therefore shouldn’t be used in scouting defensive ends. As for the SPS, the trend held firm over all 19 seasons, reinforcing the potential predictive power of the SPS for Quarterback prospects.
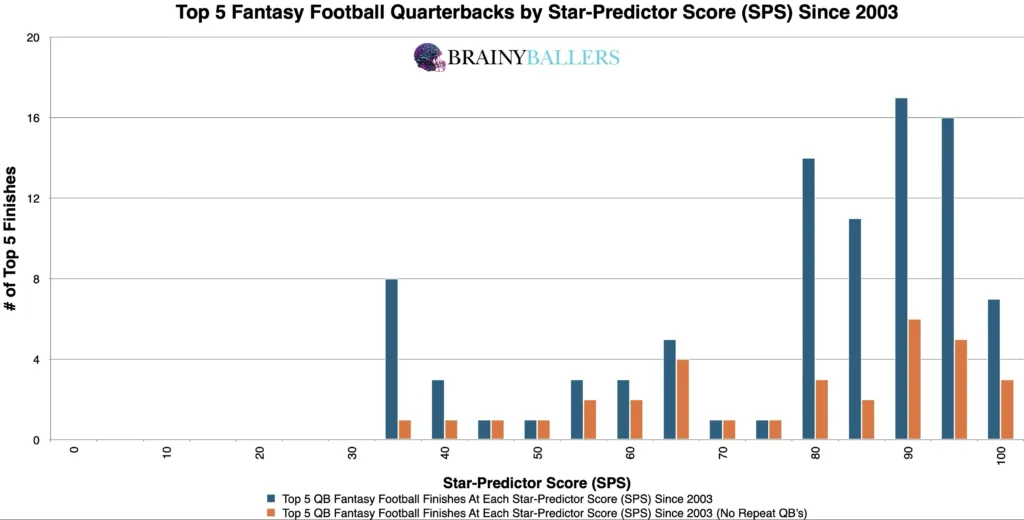
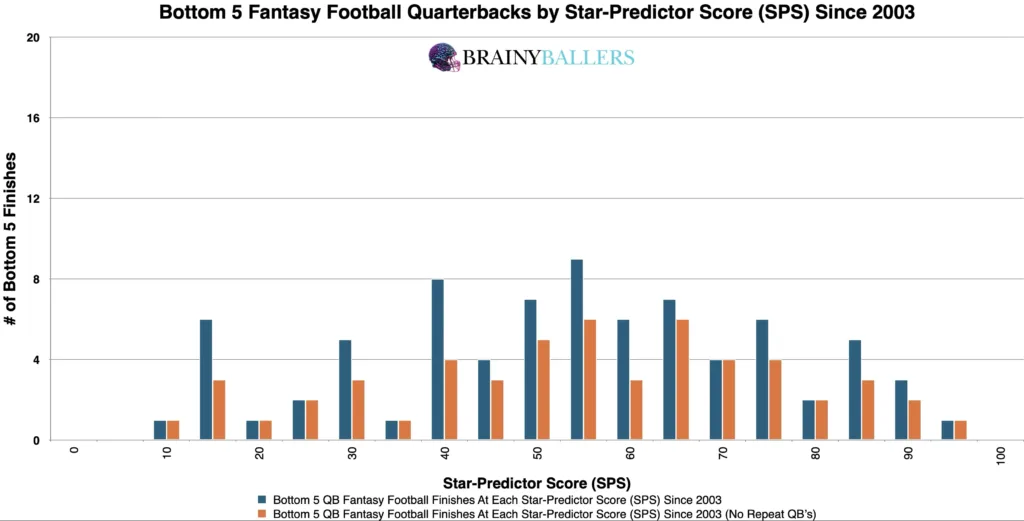
Additionally, we segmented out the top and bottom 5 finishers since 2003 into rounded SPS grades of every 5.0. This further confirmed the correlation between elevated SPS scores and impressive fantasy outcomes. This was evident by evaluating the weight and distribution of both of these charts, where you will see the top 5 coming first:
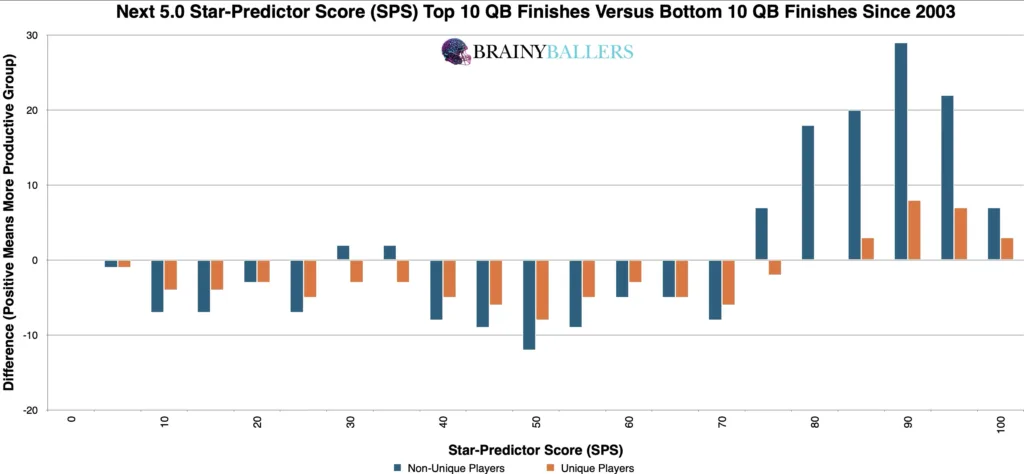
Our primary goal was to determine the SPS threshold that most consistently predicts top-level performances. We analyzed this by creating a differences chart. This chart compared each SPS score plus the next 5.0 SPS, subtracting the bottom 5 results from the top 5 within each group. The chart’s desired outcome is a negative number for unique differences (Orange) and a positive number for non-unique differences (Blue). This would indicate the top level consistency we are hoping for. From this, it appears as though 75 and above appears to be the top producing range, which we will attempt to verify or alter next.
To ensure this is the top producing range, we adjusted the range our differences chart led us to for testing other ranges. Through testing, we discovered that an SPS of 70.0 and above has a top 5 appearance rate increase of 44.0% compared to the bottom 5. Therefore, this refined range is the future benchmark you should look for in athletes. Although this is great, the next question is now how much does this matter?
The validity of using the SPS to scout prospects was further confirmed through standard statistical methods. We computed the Pearson Value when relating SPS grades to fantasy points every season since 2003, which can be seen below:
This indicated a great correlation between a QB’s SPS and future fantasy performances. For analyzing world-class athletes as we are, a Pearson value exceeding 0.1, or less than -0.1 is desired. In comparison to other metrics we’ve researched, we’ve researched 52 other stats and metrics for Quarterbacks. The highest we’ve seen thus far in a Pearson value is Average Depth of Target (ADOT), which prevailed a Pearson value of 0.32. Even draft capital, which showed correlations of -0.219, came in lower than the SPS. This further advocates the predictive ability of the SPS metric in predicting future performance.
For those curious about the correlation coefficient when comparing draft capital and career fantasy points, and then comparing SPS grades to career fantasy points, here it is:
Now going down to all players between the 1st overall and 60th overall NFL Draft picks:
As you can see, the gap of the significance difference closes when going down to the 60th overall pick, although it’s still more predictive. This gap continued to dwindle when including more rounds, although the SPS was still slightly more predictive than draft capital for all rounds and all UDFA since 2003. This is the reason only the top 60 overall NFL Draft picks will be published, with extra insights coming through rankings, social media, etc.
Explaining the Pearson Value: Positive and negative Pearson values can be equally significant but in opposite ways. In the SPS example seen above, lower (higher value) overall draft capitals suggest a high probability of fantasy scoring, while higher SPS grades strongly indicate a higher fantasy score probability – and in a more significant way than draft capitals do.
To see whether the SPS is a growing or dying trend, we grouped athletes into the top 5, 6-25th, and bottom 5 categories and split them up into the last 2 decades. Our decadal differences chart showed a noticeable increase in the significance of our optimal SPS range in the most recent decade. This indicates that the top performers are increasingly falling within this defined range, highlighting its growing relevance in today’s game.
| 2004-2013 | |||
| Top 5 | 6 through 25 | Bottom 5 | |
| All count | 49 | 194 | 49 |
| All 70 and above | 26 | 32 | 5 |
| % (Optimal Range/all) | 53.1% | 16.5% | 10.2% |
| 2014-2023 | |||
| Top 5 | 6 through 25 | Bottom 5 | |
| All count | 50 | 200 | 50 |
| All 70 and above | 40 | 94 | 15 |
| % (Optimal Range/all) | 80.0% | 47.0% | 30.0% |
As far as the SPS table itself, users can filter and search data efficiently by applying parameters such as year, position, name, SPS scores, or colleges. The green cells in both SPS columns shows that the player is within the optimal range for future success chances. If you’re in green, you’re atop the bellcurve, with 100 being at the very top of the bell curve. The yellow indicates where the performance likelihood decline starts and transitions to red to indicate the players who are on the exponentially declining sides of the bellcurve. These tools and capabilities make it an invaluable asset for evaluating Quarterback performances and finding sleepers or comparing player analytical profiles and future outlooks.

The Star-Predictor Score (SPS) is a scouting tool designed to maximize investment potential and reduce risks when drafting rookies in Fantasy Football. It is proven to have a higher accuracy than draft capital alone to predict fantasy success. The SPS includes 13 to 17 metrics, with the exact number varying by the player’s position. All these metrics are pre-NFL, and some are invented by us, providing a complete analysis of a player’s analytical profiles. The SPS gained widespread notoriety for its high accuracy, having made it on Barstool and The Pat McAfee Show. The SPS can be found here.
What 3 metrics matter the most when scouting a rookie Quarterback? What threshold should Quarterbacks achieve within those metrics to be considered an elite prospect? How much should you value those stats above all other stats? Couldn't answer those questions? Rest easy, we have it handled for you. That's what this chart answers. Sort by importance and/or filter by position. Unlock by signing up with the links provided. $9.99/Year or $24.99 Lifetime access. Cancel anytime.
The Star-Predictor Score (SPS) was built as a prospect scouting tool aimed at maximizing investment potential while minimizing risks when drafting rookies in Fantasy Football. With a consistent correlation between higher SPS scores and successful fantasy outcomes, SPS provides the most dependable standard for predicting career fantasy points. Our analysis found that 70.0 and above SPS is the optimal range you should be hoping for in your favorite athletes. Follow us on social media for live draft updates on final SPS rookie grades.
Our series has always sought to push the boundaries of sports analytics. This latest installment reaffirms our commitment to uncovering the hidden dynamics that define the game. Every Saturday, we’ll dive into intriguing questions, bust myths, and settle debates with thorough analysis. We welcome your input. Therefore, please leave comments or reach out with topics you’re eager to see dissected. All of our research can be found on our Analytics Page. Up next on our agenda for Part 55 of “Does It Matter?” is an examination of Quarterback College Passer Rating: Does it matter? If so, what’s the Passer Rating threshold necessary for NFL success? Mark your calendars; every Saturday we shed light on the topics that matter to you. All it takes is a quick question being asked and we will go to work for you!


BrainyBallers Buy-Hold-Sell Chart (All Players)
Get Your Products 100% Refunded By Predicting The Next SuperBowl Winner!
In our extensive 65-part “Does It Matter?” series, we have explored various metrics to gauge their effectiveness in predicting an NFL player’s

When evaluating talent for the NFL, analysts often look at a player’s college performance to predict their professional success. In our 64-part

In our 63-part analytical series, “Does It Matter?”, we next wanted to look into the intriguing question of whether a Tight End’s
